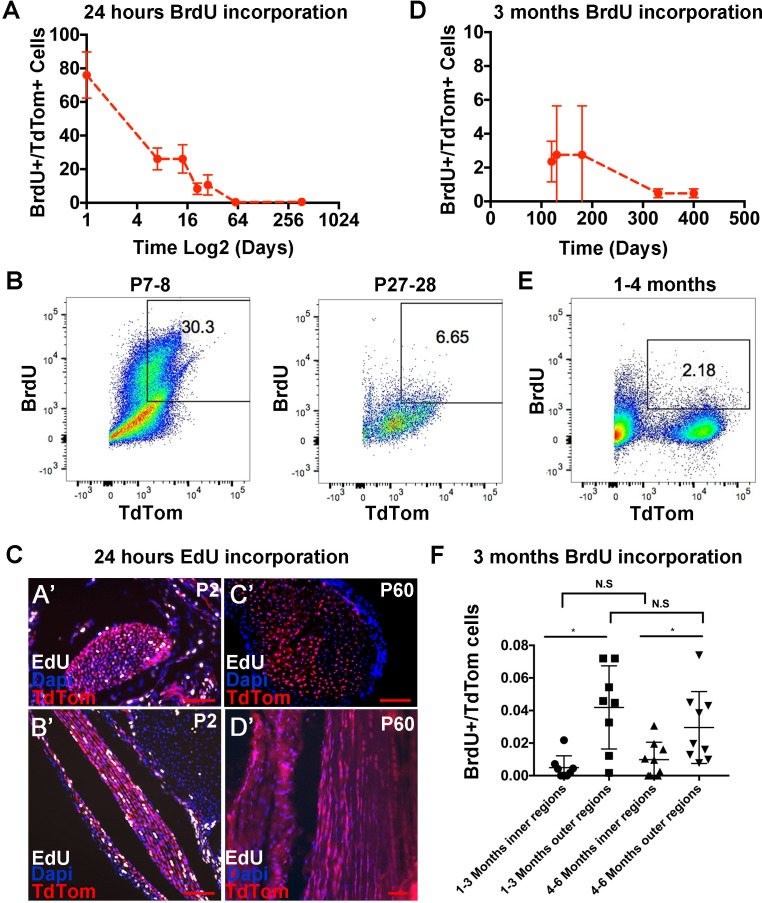
Figure 3. Analysis of tendon cell proliferation using short and long pulses of BrdU/EdU.
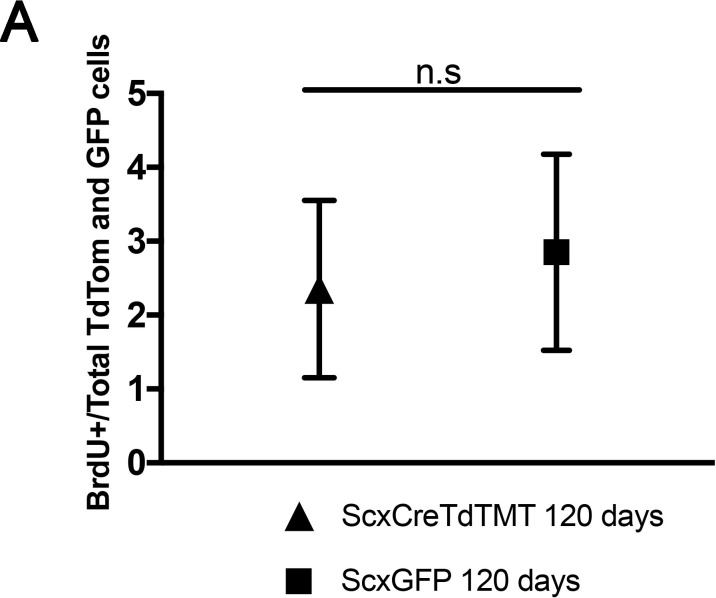
Examination of BrdU incorporation 24 hr after BrdU injection reveals higher BrdU incorporation rates at P0 through P14 compared with P21 and later stages (A). Representative flow cytometry of 24 hr BrdU labeled Scx-Cre;TdTom+ tendon cells shows 30.3% BrdU+/TdTom+ cells at P8 and 6.65% BrdU+/TdTom+ cells at P28 (B). 24 hr EdU labeling identifies a significant number of proliferating cells at P2 (C, A’, B’), but no EdU+ cells were observed at P60 (C, C’,D’). Administration of BrdU for over 90 days after P30 shows low but detectable levels of BrdU incorporation from 120 to 400 days (D). Example flow cytometry shows 2.18% BrdU+/TdTom+ cells after 3 months of BrdU incorporation (1–4 months, (E). Quantification of BrdU+/TdTom+ cells in tendon sections (F) shows a similar percentage of incorporation as the flow cytometry analysis and significantly more BrdU incorporating nuclei in outer Achilles tendon regions compared with inner regions at either 3 and 6 months. For all experiments, n = 3 mice were examined per stage. Error bars are standard deviation. Scale bars = 100 µm.


