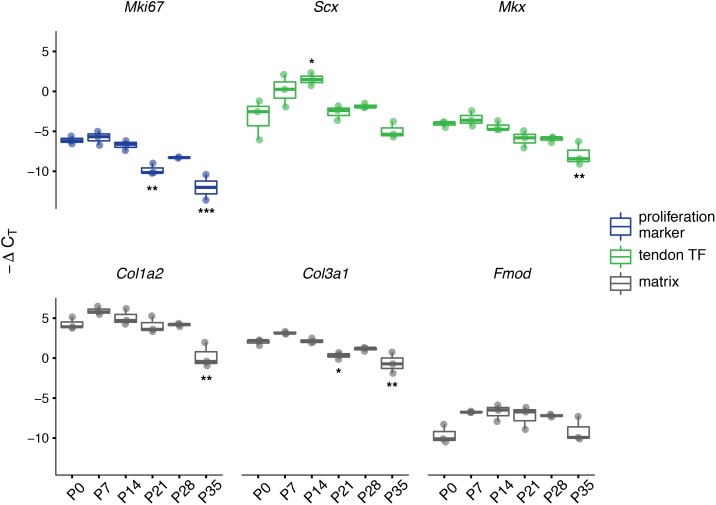
Figure 4. Expression of tendon and matrix related genes changes during the transition in cell division rate.
RT-qPCR of selected markers of proliferation (Mki67; blue), tendon transcription factors (TFs, Scx and Mkx; green), and extracellular matrix (Col1a2, Col3a1, and Fmod; gray). Relative expression was calculated using the ∆CT method using Gapdh as the reference gene. For all genes assayed, significant differences between all six time points were found via ANOVA (p<0.05). Stars indicate significant differences based on Tukey’s HSD compared to P0 only (*p<0.05; **p<0.01; ***p<0.001). See Supplementary file 1 for ANOVA statistics and full report of post hoc pairwise comparisons. n = 3 biological replicates per time point. Boxplot edges represent the interquartile range (IQR) and the middle line represents the median. Whiskers represent 1.5 x IQR.

