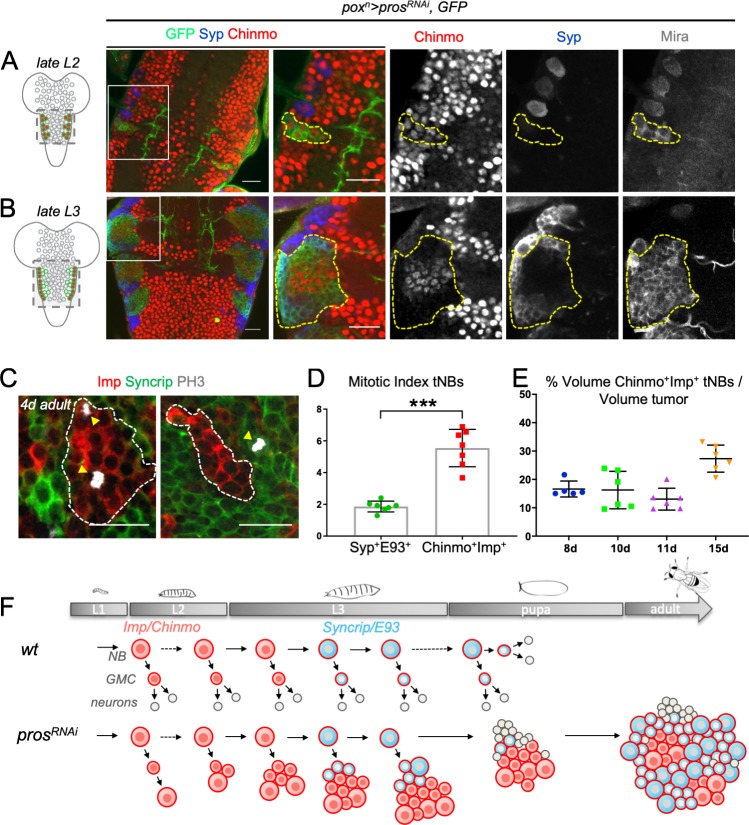
Figure 2. Dynamics of cell heterogeneity in poxn > prosRNAi NB tumors.
(A,B) Cartoons represent a ventral view of the Drosophila CNS at late L2 and late L3. Gray circles represent normal NBs. Green circles are prosRNAi tNBs. Red tNBs express chinmo. Tumors were induced by knocking down pros in six NBs located in the VNC, throughout larval development, using the poxn-Gal4, UAS-prosRNAi, UAS-GFP, UAS-dicer2 system (poxn > prosRNAi). Because chinmo is always co-expressed with Imp in NBs, we use either anti-Chinmo or anti-Imp to label Chinmo+Imp+ tNBs. We also used Syp to label Syp+E93+ tNBs. (A) poxn > prosRNAi initially induces pools of tNBs all expressing Chinmo in early larvae (L2). tNBs are marked with anti-Mira and anti-GFP. (B) In late larvae (L3), poxn > prosRNAi tumors are composed by two distinct populations of tNBs respectively expressing Chinmo and Syp. Tumors are marked with anti-GFP and delineated by dashed lines. (C) Mitotic Imp+ tNBs and Syp+tNBs are marked with anti-PH3 in poxn > prosRNAi tumors persisting in 4-day-old adults. (D) Quantification of the mitotic index of Chinmo+Imp+ tNBs (n = 7 VNCs) and Syp+E93+ tNBs (n = 7 VNCs) in poxn > prosRNAi tumors of 4-day-old adults. p=0.0006. (E) Proportion of Chinmo+Imp+ tNBs over all tNBs composing tumors (volumes of each population are measured) at 8 days (8d) (n = 5), 10d (n = 6), 11d (n = 6) and 15d (n = 6) after tumor induction. Each dot represents the % for one tumor. (F) Scheme depicting the dynamics of tumor composition: from a homogeneous pool of Chinmo+Imp+ tNBs in early larvae to a heterogeneous tumor with a minor population of Chinmo+Imp+ and a majority of Syp+E93+ tNBs. Scale bars, 20 µm.


