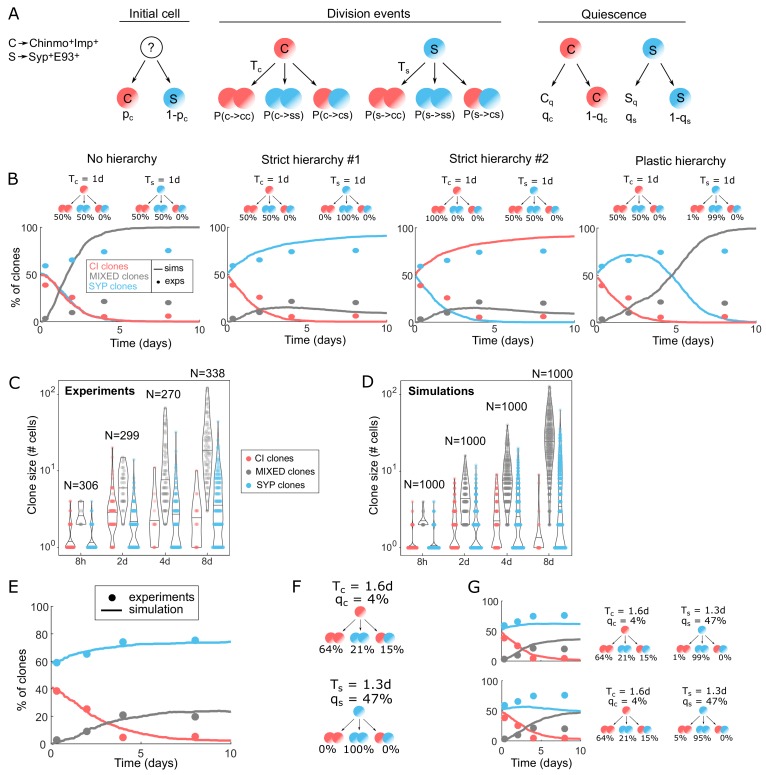
Figure 4. Modeling tumor hierarchy and the dynamics of cellular heterogeneity.
(A) Cartoon of the stochastic clone model. C stands for Chinmo+Imp+ tNBs, S stands for Syp+E93+ tNBs. Tc means ‘division time of Chinmo+Imp+ tNBs’, Ts means ‘division time of Syp+E93+ tNBs’. Cq stands for quiescent Chinmo+Imp+ tNB, Sq stands for quiescent Syp+E93+ tNB. qc and qs are the probabilities for Chinmo+Imp+ and Syp+E93+ tNBs to be quiescent after being generated. (B) Dynamics of proportion for each clone category in four extreme model scenarios: No hierarchy, Strict hierarchy #1, Strict hierarchy #2, Plastic hierarchy. Solid lines represent the simulations (n = 1000 clones), dots represent experimental measurements. Cartoons above graphs represent the division probabilities used to generate each graph. (C) Violin plots depicting distributions of clone sizes (number of cells) for each category calculated from the experiments. (D) Violin plots depicting distributions of clone sizes (number of cells) for each category of clones after simulation, using the set of parameters minimizing the error. Center lines of boxes show the medians. (E) Proportion of clones over time in each category using the set of parameters minimizing the error. Solid lines represent the simulations (n = 1000 clones), dots represent experimental measurements. (F) Hierarchical scheme able to recapitulate the dynamics of clone growth and composition, with the parameters measured from the experimental data and defined by the fit. (G) Proportion of clones in each category using the set of parameters minimizing the error while allowing a small chance of reverse division from S to C (top: 1%, bottom: 5%).
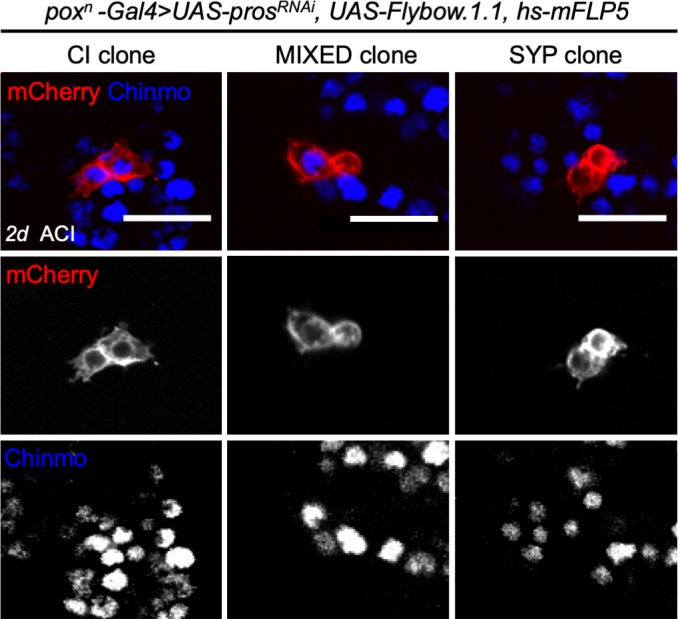
Figure 4—figure supplement 1. Three categories of two-cell clones in poxn > prosRNAi NB tumors suggesting that tNBs can undergo fate symmetric and fate asymmetric divisions .


