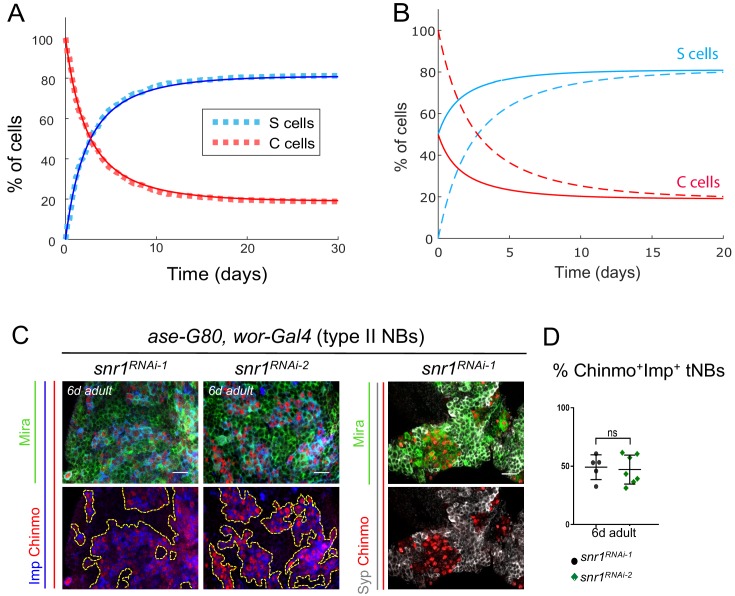
Figure 5. The final proportions of Chinmo+Imp+ and Syp+E93+ tNBs are not influenced by their initial proportions and depend on the tumor type.
(A) Proportion of Syp+E93+ (blue) and Chinmo+Imp+ (red) tNBs over time using the set of parameter values determined by the error minimization and starting from 100% of Chinmo+Imp+ tNBs. Dashed lines represent a stochastic simulation (clone model), thin lines represent the prediction of the deterministic model. An equilibrium is rapidly reached were Chinmo+Imp+ tNBs represent about 20% of all tNBs. (B) Dashed curves: evolution of the proportions of Syp+E93+ (blue) and Chinmo+Imp+ (red) tNBs, as predicted by the deterministic model, when starting with 100% of Chinmo+Imp+. Plain curves: evolution of the proportions of Syp+E93+ (blue) and Chinmo+Imp+ (red) tNBs, as predicted by the deterministic model, when starting with 50% of Chinmo+Imp+ and 50% of Syp+E93+ tNBs. In both scenarios, the same equilibrium is reached. (C) UAS-snr1RNAi transgenes are expressed in type II NBs using the ase-Gal80, wor-Gal4, UAS-dicer2 system causing NB tumors that persist in the CB of adult flies. tNBs in 6-day-old adults are marked with Mira, Imp, Chinmo and Syp. (D) Proportion of Chinmo+Imp+ tNBs in ase-G80, wor > snrRNAiRNAi-1 (n = 5 CB) and ase-G80, wor > snrRNAiRNAi-2 (n = 7 CB) tumors in 6-day-old adults (volume of Chinmo+Imp+ tNBs over volume of all tNBs x 100) . p=0.0061. Scale bars, 20 µm.

