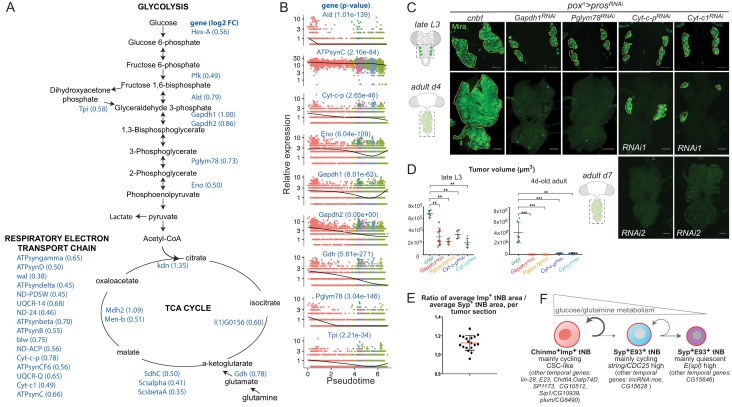
Figure 8. The Imp-to-Syp transition triggers down-regulation of glutamine and glucose metabolism genes along the differentiation trajectory to reduce tNB growth and proliferative potential.
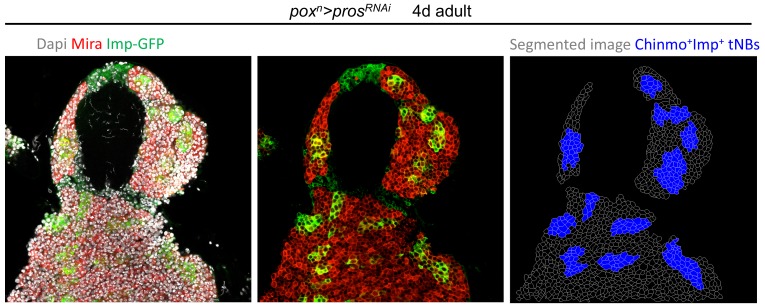
(A) Glucose metabolism pathways (glycolysis, TCA cycle and respiratory electron transport chain). Genes whose expression is enriched in poxn > prosRNAi, SypRNAi tumors compared to poxn > prosRNAi tumors are highlighted in blue. Log2 fold change is indicated in brackets. (B) Expression dynamics of various glycolytic, respiratory electron transport chain and glutamine metabolism genes along the tumor pseudotime. p-values for differential expression along the pseudotime are indicated for each gene. (C) poxn > prosRNAi NB tumors are marked with anti-Mira (green). Silencing of glycolytic (Gapdh-1RNAi, Pglym78RNAi) or respiratory genes (Cyt-c-pRNAi, Cyt-c1RNAi) leads to smaller poxn > prosRNAi tumors in late L3 larvae. Silencing of glycolytic or respiratory genes arrests tumor growth in 4-day-old and 7-day-old adults respectively. (D) Volumes of poxn > prosRNAi tumors (n = 5 VNC), poxn > prosRNAi, Gapdh-1RNAi tumors (n = 7 VNC); poxn > prosRNAi, Pglym78RNAi tumors (n = 5 VNC); poxn > prosRNAi,Cyt-c-pRNAi tumors (n = 5 VNC); and poxn > prosRNAi,Cyt-c1RNAi tumors (n = 5 VNC) in late L3. PCntrl/Gapdh-1RNAi = 0,002. PCntrl/Pglym78RNAi = 0,007. PCntrl/Cyt-c-pRNAi= 0,007. PCntrl/Cyt-c1RNAi = 0,007. Volumes of poxn > prosRNAi tumors (n = 6 VNC); poxn > prosRNAi, Gapdh-1RNAi tumors (n = 8 VNC); poxn > prosRNAi, Pglym78RNAi tumors (n = 9 VNC); poxn > prosRNAi, Cyt-c-pRNAi tumors (n = 10 VNC); and poxn > prosRNAi, Cyt-c1RNAi tumors (n = 6 VNC) in 4-day-old adults. PCntrl/Gapdh-1RNAi = 0,0007. PCntrl/Pglym78RNAi = 0,0002. PCntrl/Cyt-c-pRNAi = 0,0002. PCntrl/Cyt-c1RNAi = 0,002. Scale bars, 50 µm. (E) Each dot represents the average area of Chinmo+Imp+ tNBs over the average area of Syp+E93+ tNBs for a single confocal section of a poxn > prosRNAi NB tumor in a 4-day-old adult. (F) Schematic representation of the tumor hierarchy. Chinmo+Imp+ tNBs are proliferative and tend to self-renew. However, they can also engage in a differentiation process triggered by the Imp-to-Syp transition and involving a subset of larval temporal genes. Syp+E93+ tNBs can self-renew but also tend to exit the cell-cycle as they decrease expression of glucose/glutamine metabolism genes. Syp+E93+ tNBs, that have exited the cell-cycle, express genes of the E(spl) family. The mechanisms controlling the Imp-to-Syp transition in NB tumors, to determine the CSC proportion are unknown.
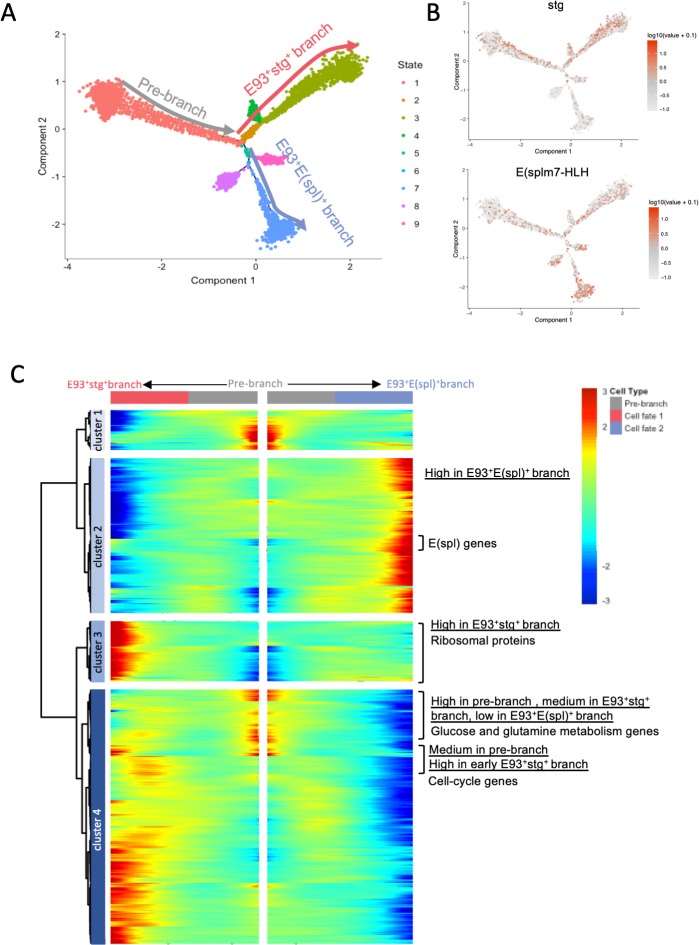
Figure 8—figure supplement 1. nAChRalpha3 and nAChRalpha5 are expressed in tNBs positioned at the beginning of the pseudotime.


