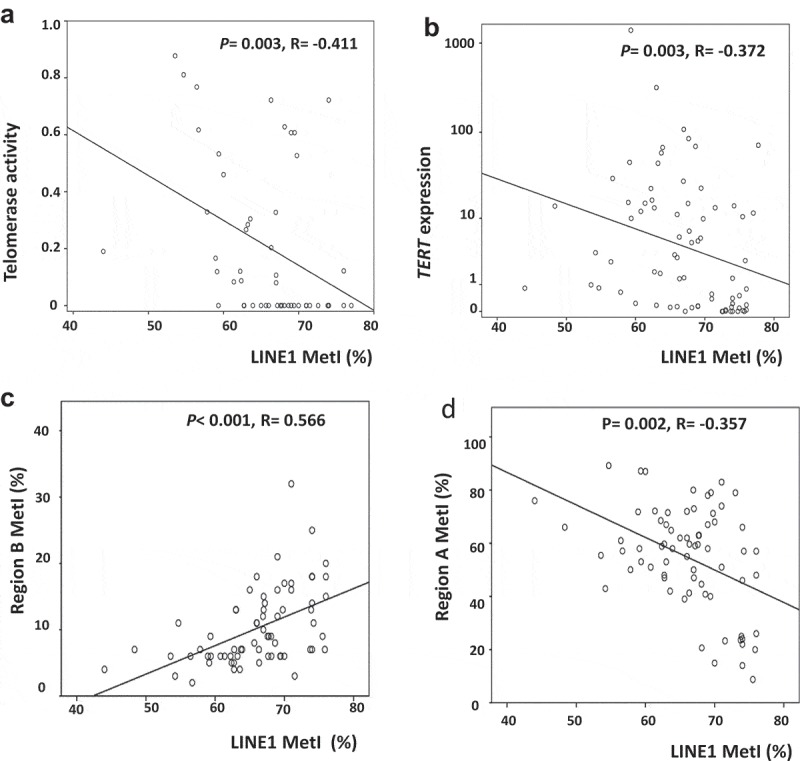
Figure 3.

Aberrant LINE1 methylation in SI-NETs. (a) Inverse correlation between LINE1 MetI and telomerase activity. (b) Inverse correlation between LINE1 MetI and TERT expression. (c) Correlation between LINE1 MetI and Region B MetI. D. Inverse correlation between LINE1 MetI and Region A MetI.
