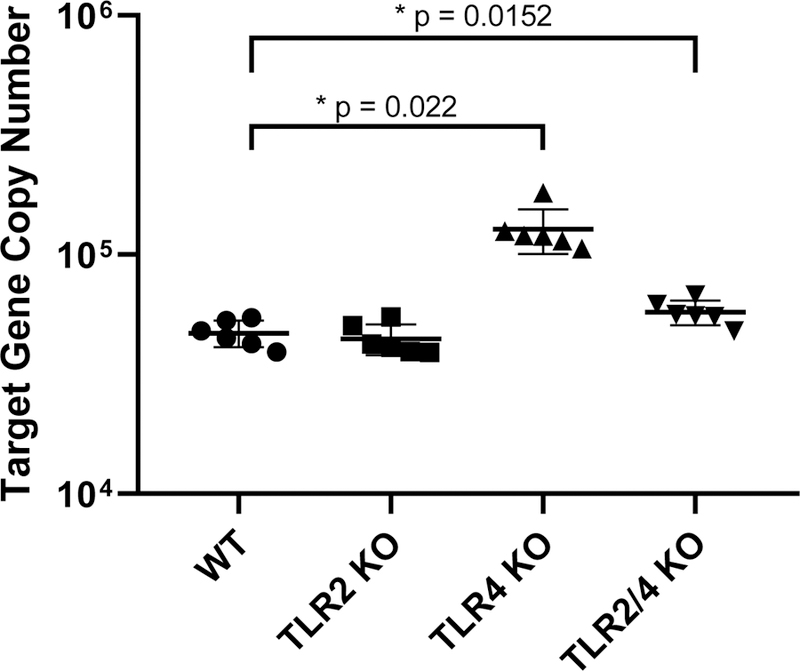
Figure 2.

Bacterial load reveals disruption of bacterial homeostasis in some but not all TLR KO mice. Total bacterial load is represented by the copy numbers of 16S rRNA gene for each oral swab sample (n=6 / group) by real-time PCR assays in a scatter dot plot. Significance was determined using the Mann-Whitney test. (*) p < 0.05, (**) p < 0.01, (***) p < 0.001
