Figure 3.
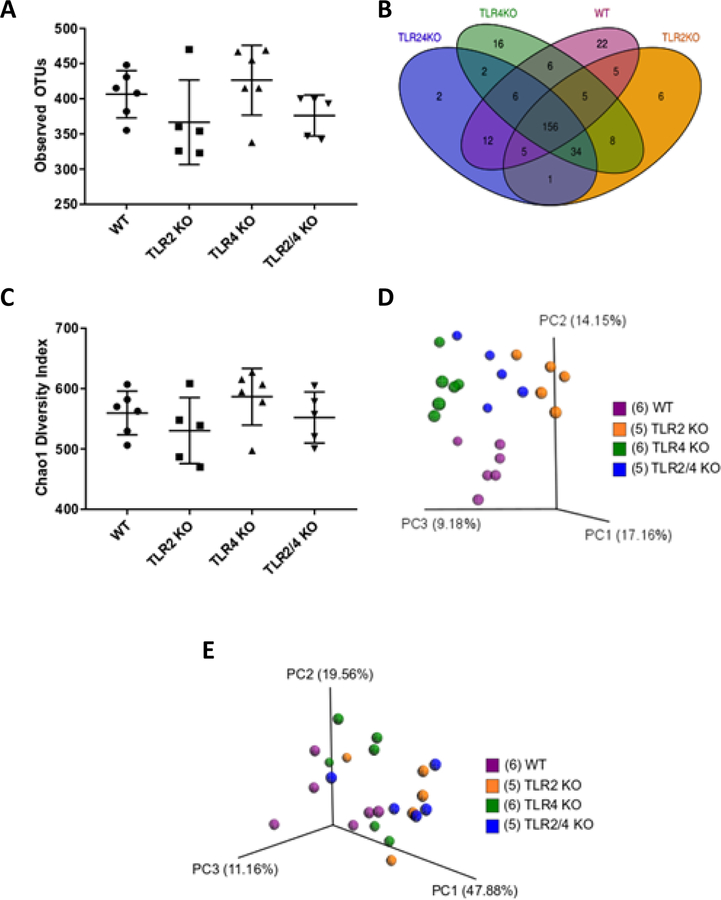
Beta diversity, but not alpha diversity measurements show clear differences in microbial compositions between TLR and WT mice (n=5–6 mice / group).
A. Scatter dot plot comparing total observed operational taxonomic units (OTUs). Alpha diversity measure by total OTUs showed no statistically significant difference between mice groups.
B. Venn diagram comparing OTU specific sequences amongst mice groups reveal the number of both unique and shared OTU representations in and amongst each mouse group.
C. Scatter dot plot comparing the Chao1 diversity index did not show differences in species richness amongst mouse groups.
D. Beta diversity patterns using Principal Coordinate Analysis (PCoA) of unweighted UniFrac distances show clustering of mice within the same group, but spatial segregation between different groups.
E. PCoA of weighted UniFrac distances reveal moderate clustering within each group, but moderate spatial segregation between different groups.
Each dot represents a single mouse and each color represents a mouse group.

