
Figure 5.
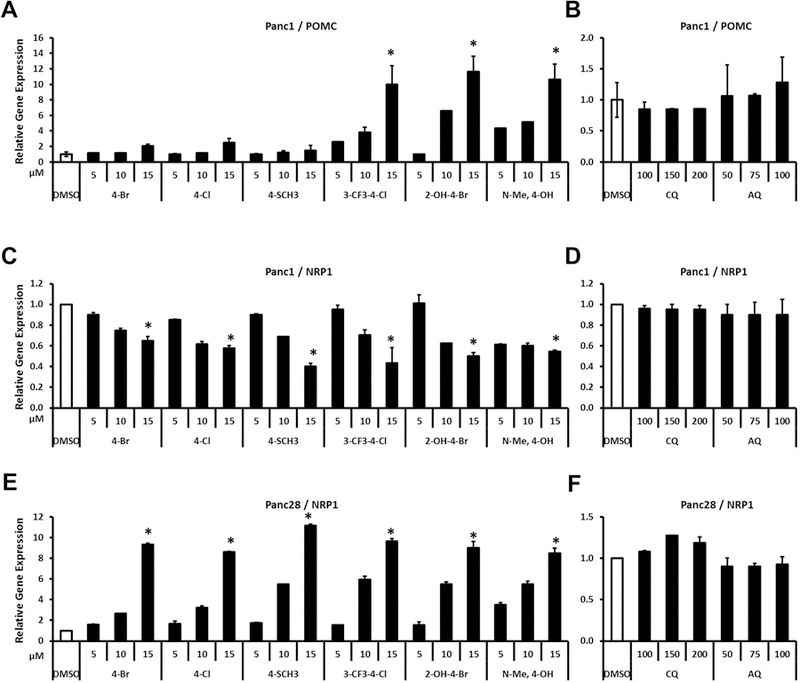
Effects of bis-indole analogs and quinoline derivatives on POMC and NRP1 gene expression. Panc1 (A, B, C and D) and Panc28 (E and F) cells were treated with bis-indole analogs (5, 10 and 15 μM), CQ (100, 150 and 200 μM) or AQ (50, 75 and 100 μM). Relative expression levels of POMC and NRP1 were determined by quantitative PCR analysis as described in Materials and Methods. Results are expressed as means ± SD for at least six independent determinations for each treatment. The asterisk (*) indicates significant gene induction/repression (P < 0.01) of the highest concentration treatment vs. solvent control (DMSO).