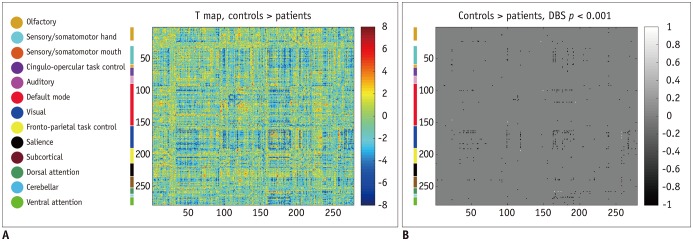
Fig. 2. Whole brain functional connectivity and differences between healthy controls and patients with traumatic anosmia.
A. Functional connectivity differences are shown as t-statistic matrix, where positive values indicate lower connectivity in patients and vice versa. B. Functional connectivity with significant difference between groups through cluster-wise inference methods. White color indicates significantly lower functional connectivity and black color indicates significantly higher functional connectivity in patients with anosmia with corresponding anatomic locations appearing on color blocks and each color indicating different anatomic functional location from one shown in left column. Functional connectivity was generally higher in significant clusters for patients. DBS = degree-based-statistic

