
Figure 4. ARID Subunits Dictate Specific Branches of BAF and PBAF Complex Assembly.
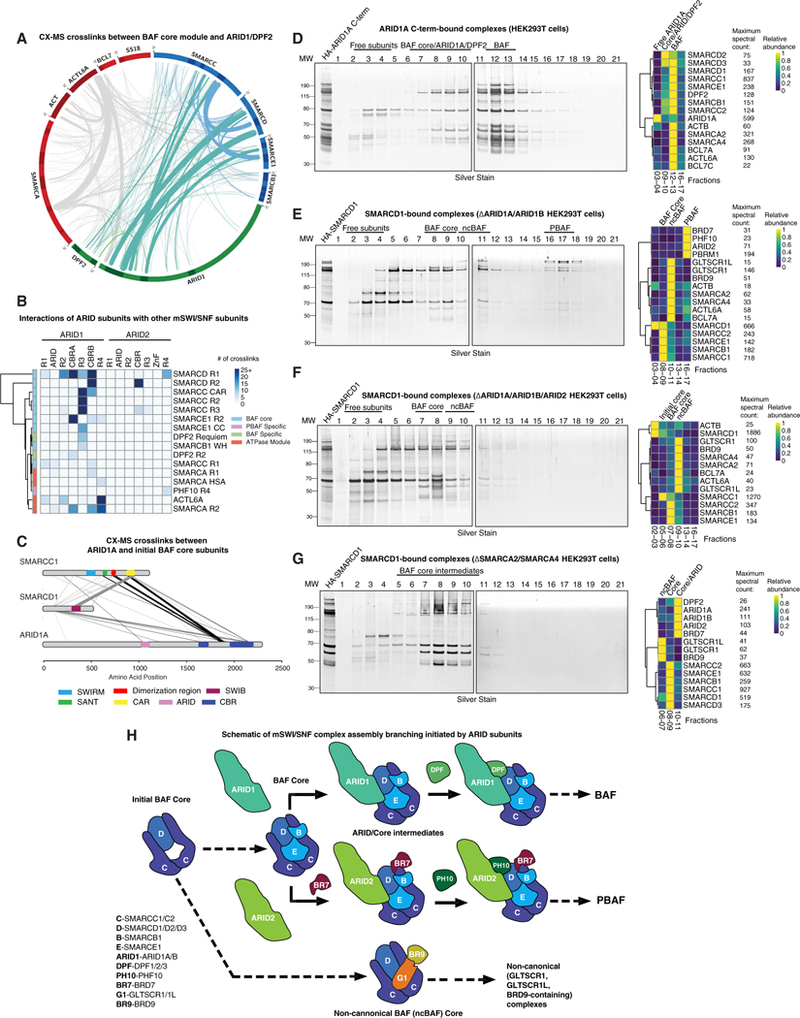
(A) Circle-plot analysis of the mammalian cross-linking mass spectrometry dataset, with BAF core subunit crosslinks in blue and ARID module subunits in teal.
(B) Clustered heatmap of cross-linking mass spectrometry data, highlighting crosslinks between ARID subunits and other complex components.
(C) ARID1A, SMARCC1, and SMARCD1 crosslinks from the BAF cross-linking mass spectrometry dataset. Line width is proportional to the number of crosslinks.
(D) Gradient and mass spectrometry heatmap of native HA-ARID1A C terminus-bound BAF complexes purified from HEK293T cells.
(E-G) Native HA-SMARCD1 purification and gradient mass spectrometry in (E) ARID1Aand ARID1B-deficient, (F) ARID1A, ARID1B, and ARID2-deficient, and (G) SMARCA4/2-deficient HEK293T cells.
(H) mSWI/SNF assembly branch points are initiated by ARID subunits. Subunit abbreviations are indicated.
See also Figure S4.