Figure 6.
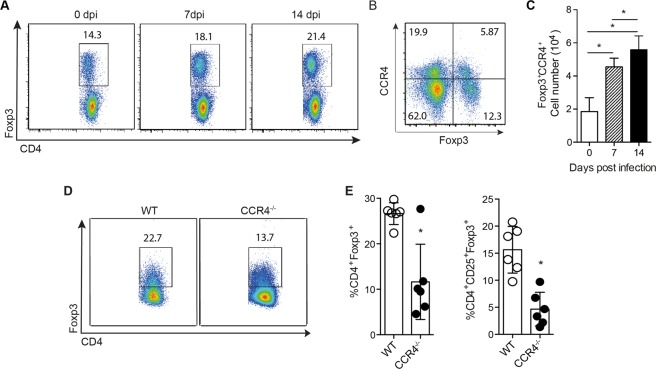
Tregs are induced upon CVB5 infection through CCR4. Foxp3-GFP mice were infected with CVB5, and Tregs were analyzed in the PLN on days 0, 7 and 14 post-infection by flow cytometry (A,C). (A) Representative dot plot of CD3+CD4+Foxp3+ cells. (B) Representative dot plot of Foxp3+CCR4+ cells at day 7 post infection. (C) Absolute number of CCR4+Foxp3+CD3+CD4+ cells (D,E) Tregs from C57BL/6 (WT) and CCR4−/− mice infected with CVB5. (D) Representative dot plot of Foxp3+ cells in CD3+CD4+ gate. (E) Percentage of Foxp3+ and CD25+Foxp3+ cells within CD3+CD4+ cells. N = 3–6 mice per group. The data are shown as the means + SEM from at least 3 independent experiments, and * indicates p < 0.05.

