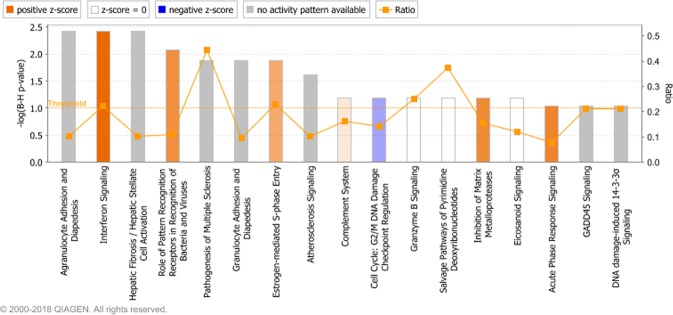
Figure 6.
The enriched canonical pathways found in the IPA analysis27 (P < 0.05, FDR <0.1). The pathways are shown on the x-axis and the –Log Benjamini-Hochberg adjusted p values are displayed on the y-axis. The threshold is set to 1 which equals a Benjamini-Hochberg adjusted p value of 0.1. The orange line representing the ratio corresponds to the ratio of the number of differentially expressed genes that map to the pathway divided by the total number of genes that map to the same pathway. Pathways with a positive z-score are predicted by IPA to have increased activity and pathways with a negative z-score are predicted to have decreased activity.

