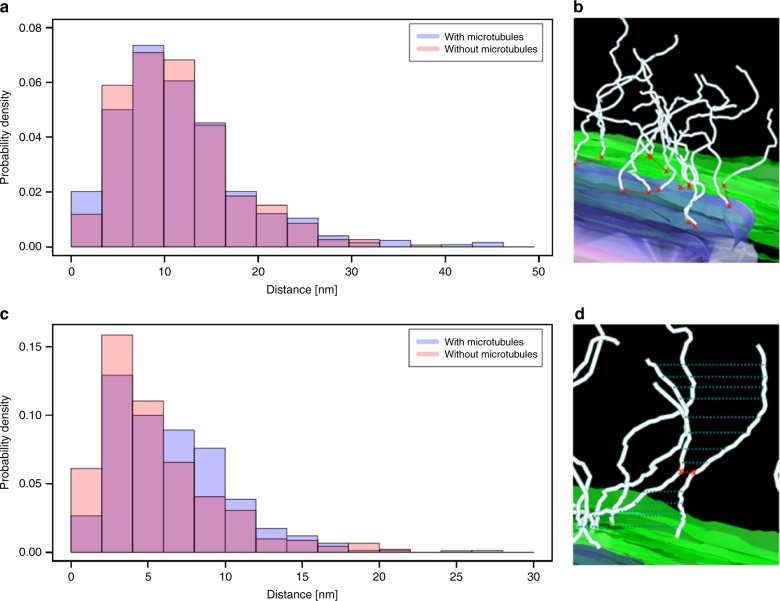
Fig. 6.
Histograms of LINC complex distributions at meiotic telomere attachments to the nuclear envelope. Minimum distances between filament origins (a, b) and minimum interfilamentous distances of two neighboring filaments (c, d) are shown. The respective distances are indicated by red crosses and red dashed lines in the magnified view of the attachments (b, d). Blue dashed lines in d illustrate that distances between all point coordinated of the neighboring filaments were measured. Inner nuclear membrane (green), attachment plate (purple), LINC complexes (light cyan)

