
Figure 5.
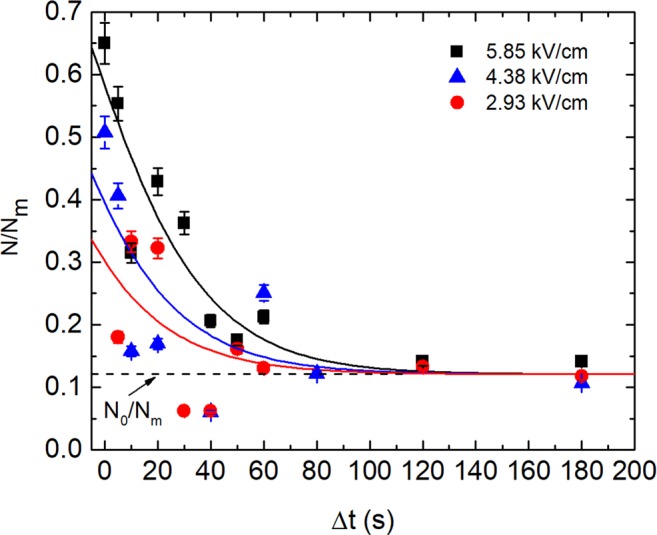
The dependence of TPP+ absorption by yeast cells over time after PEF treatment. The y axis represents the relative TPP+ amount accumulated in the yeast cells; the x axis represents the TPP+ injection time after PEF treatment. The dashed line represents the full recovery of the TPP+ absorption level by the yeast cells (PEF = 0) after 3 minutes of incubation. The solid curves were obtained by using Eq. (10), adj. R2 values are 0.854 (rectangles), 0.582 (triangles) and 0.341 (circles).