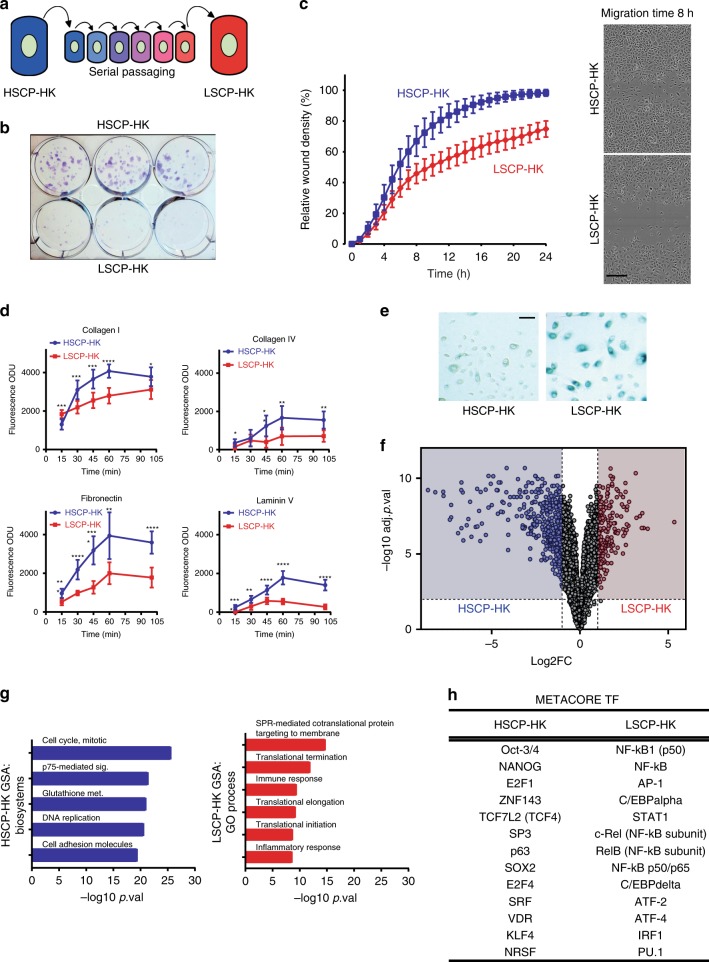
Fig. 1.
Serial passaging of keratinocyte stem cells induces loss of “stemness”. a Schematic depicting “HSCP-HKs” transformation into “LSCP-HK” by serial passaging. b Colony formation assay comparing HSCP-HKs to LSCP-HK after 8 days of culture (2000 cells/well). c Migration assay comparing HSCP-HKs to LSCP-HKs after “wounding” a confluent monolayer of cells. Representative images of HSCP-HKs and LSCP-HKs at 8 h time point are shown. Scale bar = 300 μm. d Adhesion assay comparing HSCP-HKs to LSCP-HKs with regard to attachment to Collagen I, Collagen IV, Fibronectin, or Laminin V-coated plastic in vitro. Time (min) plotted versus Fluorescence optical density units (ODU) indicative of cell number. Means ± S.D. of n = 7 technical replicates for Collagen IV and n = 8 technical replicates for Collagen I, Fibronectin, and Laminin V. One-way ANOVA with Holm-Šídák multiple comparisons test. *p < 0.05, **p < 0.01, ***p < 0.001, ****p < 0.0001. e Beta-galactosidase staining as a marker of cellular senescence comparing HSCP-HKs to LSCP-HKs in culture. Scale bar = 200 μm. f Global difference in gene expression (RNA-seq) between HSCP-HKs and LSCP-HKs, plotting fold change (FC) versus adjusted p value (adj.p.val). Differentially expressed genes are marked in red for LSCP-HK (178 genes total) versus in blue for HSCP-HK (416 genes total) with significance cut-offs defined as absolute value log2FC > 1 and −log10 adj.pval > 2. g Gene sets most enriched in HSCP-HKs (Biosystems) or LSCP-HKs (GO Process) ranked by p value (p.val). h List of transcription factors (TFs) from MetaCore Interactome enrichment tool comparing HSCP-HKs and LSCP-HKs based on global gene expression data

