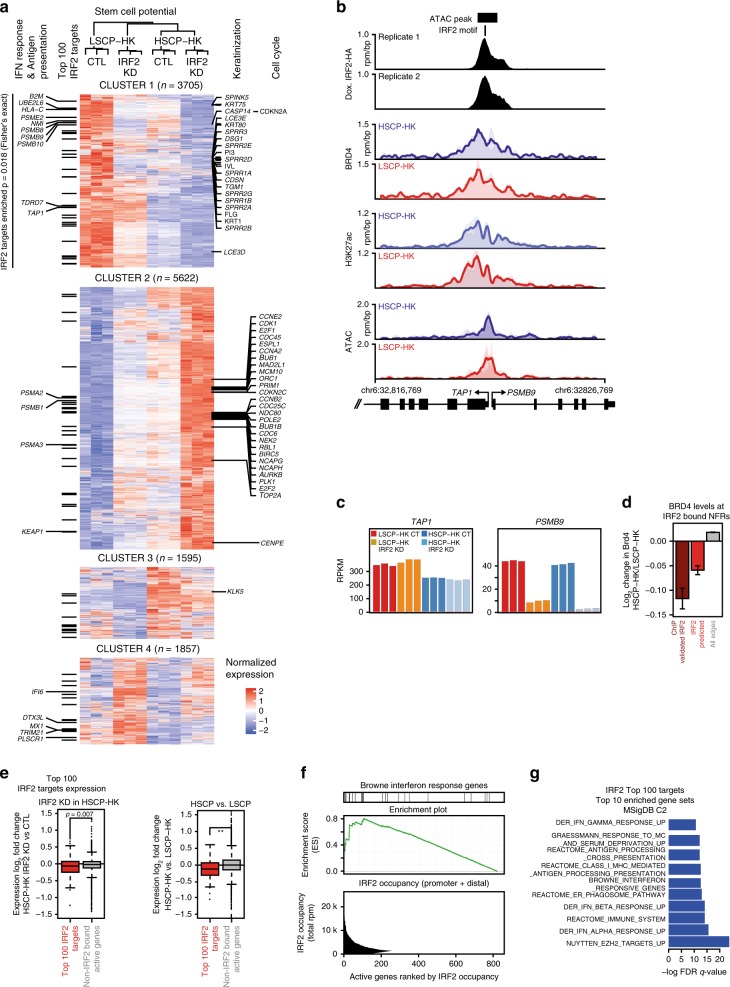
Fig. 6.
IRF2 loss of function restores HSCP-HK gene expression programs. a Hierarchical clustering (k-means = 4) of global gene expression (RNA-seq) contrasting the effect of IRF2 KD in LSCP-HK or HSCP-HK versus respective control cells. Color-code highlights gain (red) and loss (blue) across conditions. Top 100 IRF2 target genes as well as those IRF2 target genes associated with interferon response or antigen presentation are indicated on the left. Genes associated with top Gene Ontology (GO) terms from the LSCP-HK IRF2 KD versus CT expression analysis are listed on the right of the heat map (Keratinization and Cell Cycle, showing only genes with absolute log2FC > 1). b Tracks of IRF2-HA, BRD4, and H3K27ac chromatin occupancy (ChIP-seq) as well as chromatin accessibility (ATAC-seq) signal at the TAP1/PSMB9 genomic locus. c Transcript levels based on RNA-seq (RPKM) of TAP1 and PSBM9 upon IRF2 KD in either LSCP-HK or HSCP-HK across individual replicates. d Average change in BRD4 OUT degree at IRF2 edges that are either IRF2 ChIP validated (left, dark red), predicted (center, red) versus all other edges (right, grey). Error bars represent standard error of the mean. e Expression changes for top 100 IRF2 target genes versus other non-IRF2 bound active genes upon IRF2 KD in HSCP-HK (left) or when comparing HSCP-HK versus LSCP-HK (right). Significance of the difference in the distributions is denoted by a two-tailed t test **p < 1e−6. Box represents the 25–75 percentile, line represents the median, and whiskers extend 1.5× the 25–75 percentile range. f Ranking of the 855 genes with detectable IRF2 binding by total proximal IRF2 binding (from left to right, bottom panel), plotting cumulative IRF2 signal at each gene measured in units of total reads per million (rpm) of IRF2-HA ChIP-seq signal at the promoter and proximal enhancers. Top panel annotates genes associated with interferon response, middle panel shows leading edge enrichment of this gene set (GSEA). g Ranking by FDR q-value of the top 10 most highly enriched gene sets (MSigDB C2) associated with top 100 IRF2 target genes

