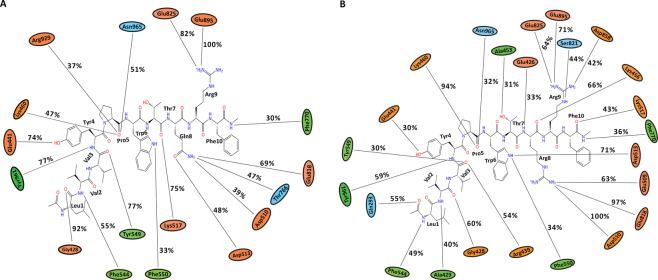
Figure 10.
Average percentage of equilibrium simulation time during which IRAP residues maintain contact with non-camel and camel LVV-hemorphin-7 from three 100 ns simulations. For equilibrium simulation data, the first 30 ns of each of the three simulations were discarded. Histograms representing the interaction from each of the 3 simulations can be found in Supplementary Fig. 7. Charged, hydrophobic and polar amino acids are represented with orange, green and blue color respectively. (A) Average percentage of time an IRAP residue maintains contact with LVVYPWTQRF. (B) Average percentage of time an IRAP residue maintains contact with LVVYPWTRRF.

