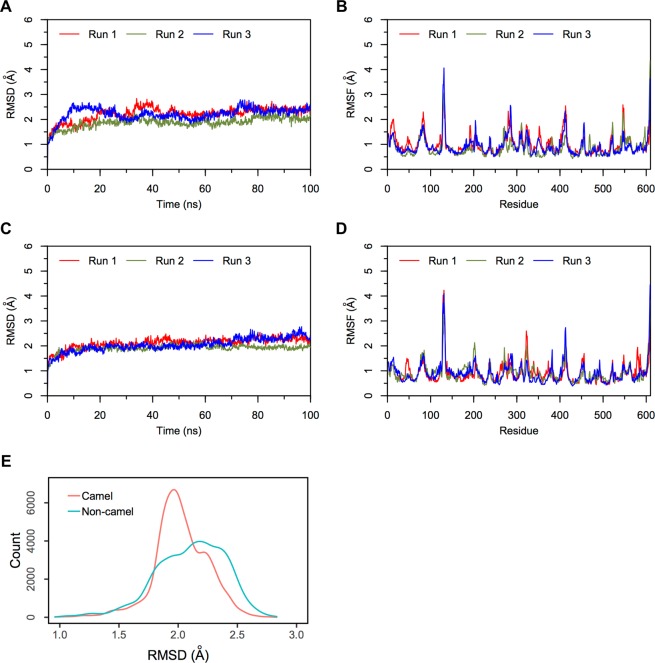
Figure 7.
RMSD and RMSF plots of triplicate 100 ns simulations of ACE. Data from the three runs are plotted with red, blue and green lines. (A) RMSD of protein Cα atoms from the ACE-LVVYPWTQRF simulations. (B) RMSF of protein Cα atoms from the ACE-LVVYPWTQRF simulations. (C) RMSD of protein Cα atoms from the ACE-LVVYPWTRRF simulations. (D) RMSF of protein Cα atoms from the ACE-LVVYPWTRRF simulations. (E) Density functions corresponding to the distribution of RMSD values from triplicate hemorphin-bound simulations.

