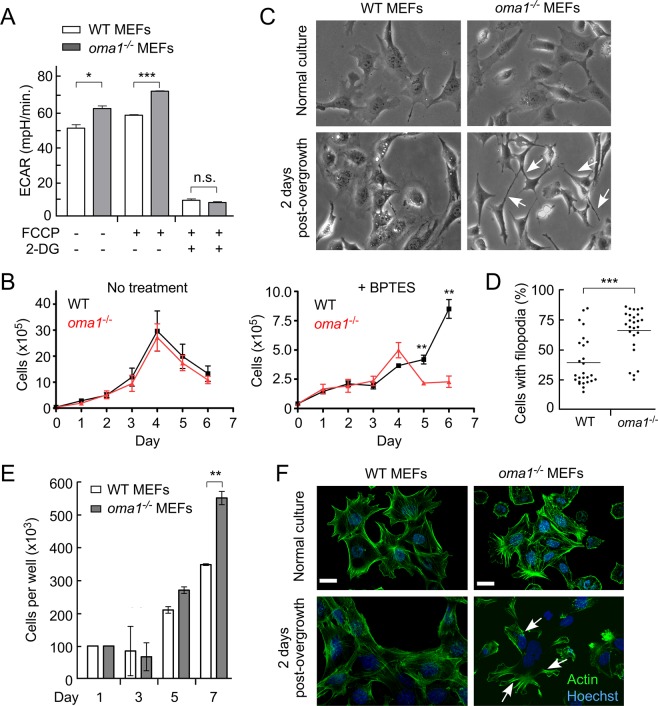
Figure 2.
Loss of OMA1 alters metabolic and proliferative properties of mouse embryonic fibroblasts. (A) Extracellular acidification rates (ECAR) in wild type and oma1−/− mouse embryonic fibroblasts under basal, FCCP-stimulated, and glycolysis-ablating (2-DG) conditions. Cells were cultured in the media containing 10 mM glucose. Data are shown as mean values of 3 independent experiments ± S.E.M.; **p < 0.01, by unpaired t-test. (B) Growth rate of wild type (WT) and oma1−/− MEF cells under conditions of glutamate pathway inhibition by BPTES. Cells were cultured in the 10 mM galactose-containing medium with (left panel) or without (right panel) 10 μM BPTES for the indicated periods of time and the number of viable cells at each time point has been assessed. Data represent the mean ± S.D. (n = 3 biological replicates); **p < 0.01, by unpaired t-test. (C) Live phase contrast images of MEF WT and oma1−/− cells at 2 days after seeding in normal culture conditions and after overgrowth for 7 days at 100% confluence. Unlike the WT cells, post-quiescent oma1−/− MEFs exhibit characteristic filopodia-like protrusions (white arrows) after overgrowth. (D) The prevalence of cells with protrusions was analyzed in WT and oma1−/− MEF cells two days after re-seeding on 6-well plates after one week of growth at 100% confluence. Each well was randomly imaged in 2–3 fields of view, each containing 15–50 cells. In the randomly chosen imaging fields, the number of cells with long filopodia and cells with normal filopodia were counted. The data was plotted as a scatter plot where each point represents percentage of cells with long filopodia of total cells in one field of view. (E) Proliferation of MEF WT and oma1−/− cells seeded after overgrowth of 7 days at 100% confluence. Data represent the mean ± S.D. of n = 3 biological replicates; **p < 0.01. (F) Paraformaldehyde-fixed WT and oma1−/− MEF cells on 2nd day after seeding post-overgrowth of 7 days at 100% confluence. Samples were stained for Actin with Alexa Fluor 488-conjugated phalloidin and imaged by confocal microscopy. The arrows mark rearranged actin patches. Scale bar, 20 μm.

