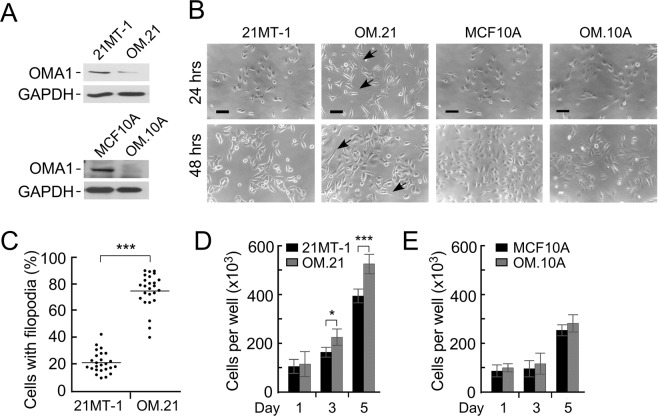
Figure 3.
OMA1 depletion in metastatic breast cancer cells promotes filopodia formation. (A) The top panel shows a representative Western blot of extracts from the metastatic pleural effusion mammary tumor 21MT-1 cells and MCF10A cells before and after transfection with either scrambled shRNA (control) or shRNA directed against OMA1 (OM.21 and OM.10 A). Steady-state levels of the protease were detected by immunoblotting with anti-OMA1. The GAPDH blots served as a loading control. (B) Live phase contrast images of 21MT-1 cells and MCF10A cells before and after transfection with scrambled shRNA (control) or shRNA directed against OMA1 (OM.21 and OM.10A) at 24 h and 48 h after seeding in normal culture conditions. Unlike the control cells, OM.21 cells exhibit characteristic filopodia-like structures (black arrows). The arrows indicate filopodia. Scale bar, 20 μm. (C) The prevalence of cells with protrusions was analyzed in 21MT-1 cells and OM.21 cells two days after re-seeding on 6-well plates after one week of growth at 100% confluence. Each well was randomly imaged in 3–4 fields of view, each containing 40–75 cells. In the randomly chosen fields of view, the number of cells with long filopodia and cells without these structures were counted. The data was plotted as a scatter plot where each point represents percentage of cells with long filopodia of total cells in one field of view. (D) Proliferation of 21MT-1 WT and OM.21 cells seeded after overgrowth of 7 days at 100% confluence. Data represent the mean ± S.D. of n = 3 biological replicates; *p < 0.05, ***p < 0.001. (E) Proliferation of MCF10A WT and OMA.10 A cells seeded after overgrowth of 7 days at 100% confluence. Data represent the mean ± S.D. of n = 3 biological replicates.

