Figure 5.
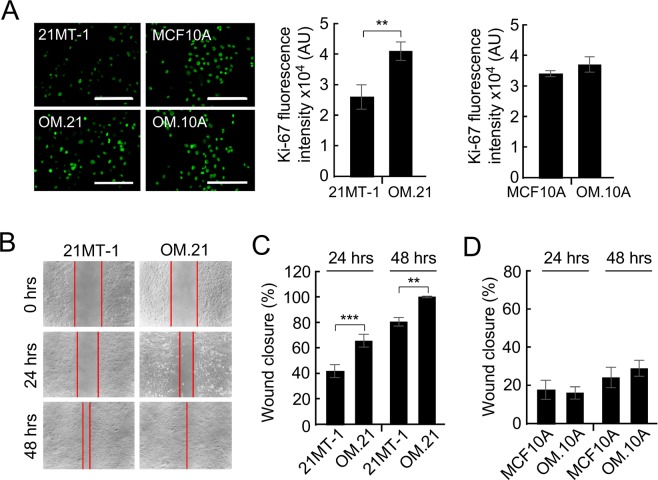
OMA1 enhances proliferation and migration of 21MT-1 metastatic breast adenocarcinoma cells. (A) Fluorescent images show Ki67 staining in MCF10A, OM.10A, 21MT-1, and OM.21 cells. Scale bar, 200 μm. Histogram shows increase in Ki67 expression in OM.21 cells compared to control cells after 2 days in culture. There is no significant difference in Ki67 expression in OM.10A and control MCF10A cells. At least three independent experiments were conducted for each analysis. (B) Data illustrating the migration of cells out from a confluent monolayer onto a featureless scratch or wound. Representative phase images of 21MT-1and OM.21 cells at 24 h and 48 h are shown. Scale bar, 20 μm. (C) Quantitative analysis of migratory properties of 21MT-1 and OM.21 cells. The extent of wound closure has been calculated as follows: % Wound Closure = [(Area at 0 h – Area at 24 or 48 h)/Area at 0 h] x 100%. Bars show mean data ± S.D. of 3 biological replicates; **p < 0.01, ***p < 0.001 by unpaired t-test. (D) Migratory properties of MCF10A and OM.10A cells were analyzed as in Fig. 4C.

