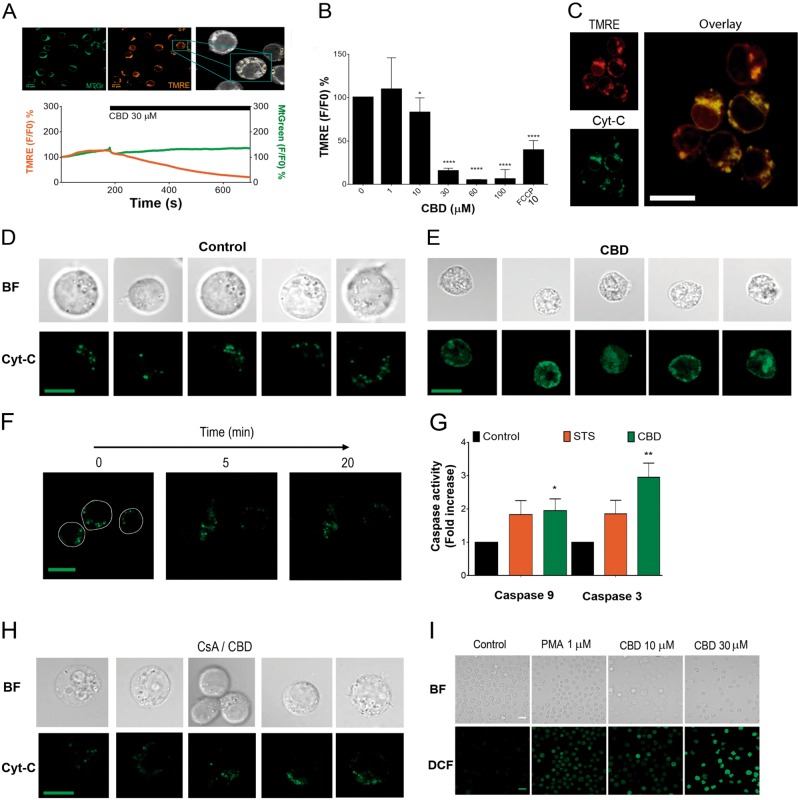
Fig. 4. CBD impairs mitochondrial function, induces Cyt-C liberation and ROS production.
a Monitoring of Δψm loss in CBD-treated leukemic cells. Jurkat cells were double-stained with MtGreen and TMRE, mitochondria (ROI) were selected (upper panel) and intensity of fluorescence was monitored by confocal microscopy after CBD (30 μM) administration (lower panel, n = 36; see also Supplementary movie 1). b Intensity of TMRE fluorescence as an indicator of Δψm in Jurkat cells, treated with different concentrations of CBD (0–100 μM) during 10 min. FCCP (10 μM) was used as a positive control. Data are mean ± SD (n = 8 in three independent experiments). Statistical comparison with control was performed by means of one-way ANOVA test (*p < 0.05; ****p < 0.0001). c EYFP-Cyt-C is localized in mitochondria of Jurkat cells after 12 h of transfection. EYFP-Cyt-C and TMRE fluorescence are colocalized (200 nM TMRE, 200 ng EYFP-Cyt-C, pseudocolor). Images were acquired by confocal microscopy at 12 h after transfection, scale bar: 10 μm. d Representative images of five Jurkat cells, transfected with EYFP-Cyt-C (as in c). Dense green fluorescent puncta (pseudocolor) reflect Cyt-C localization in intact mitochondria. Scale bar: 10 μm. e Representative images of five Jurkat cells, transfected with EYFP-Cyt-C (as in c) and treated with CBD (30 μM, 1 h). Cyt-C was released from mitochondria as evidenced by a diffuse EYFP-CytC distribution. Scale bar: 10 μm. f EYFP-Cyt-C distribution in Jurkat cells, expressing EYFP-Cyt-C, at 0, 5, and 20 min with CBD (30 μM). Scale bar: 10 μm. g Caspase-9 and caspase-3 activity in vehicle- and CBD- treated (30 μM, 12 h) Jurkat cells. Staurosporine (STS, 5 μM) was used as a positive control. After incubation, cells were lysed, and caspase activity was determined by colorimetric assay (BioVision). Fold increase in activity compared to control was plotted as mean ± SE (four independent experiments). One-way ANOVA test was performed to compare CBD-treated to control group (*p < 0.05; **p < 0.01). h Pretreatment with mPTP inhibitor CsA (10 μM) prevents Cyt-C release, induced by CBD (30 μM; 1 h). Compare these images with Fig. 4d, e (vehicle- and CBD-treated cells) and note the protective effect of CsA. Scale bar: 10 μm. i ROS production as evaluated by fluorescent microscopy in DCF-loaded (2 μM) Jurkat cells. CBD effect on ROS production was monitored after 1 h of incubation. PMA (1 μM) was used as a positive control

