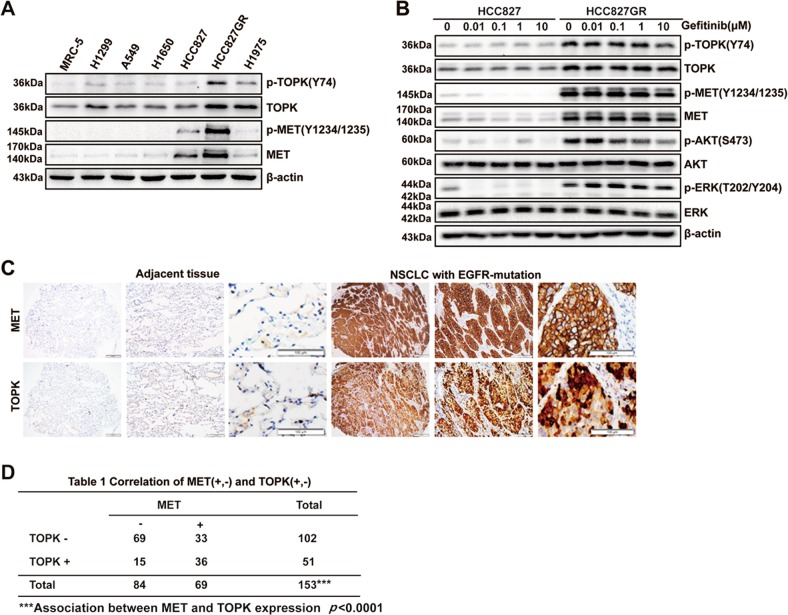
Fig. 3. The expression levels of TOPK and MET are positively correlated in EGFR-mutated NSCLC.
a Western blotting analysis in different lung cancer cells. b HCC827 and HCC827GR cells were exposed to increasing concentrations of gefitinib for 6 h. The samples were separated by SDS-PAGE and visualized by western blotting. c IHC analysis of MET and TOPK expression in TMA. Magnifications, ×40, ×100, ×200. d The correlation between MET and TOPK expression in EGFR-activating mutated NSCLC was analyzed. Data are representative of results from triplicate experiments. ***P < 0.001; R = 0.1801

