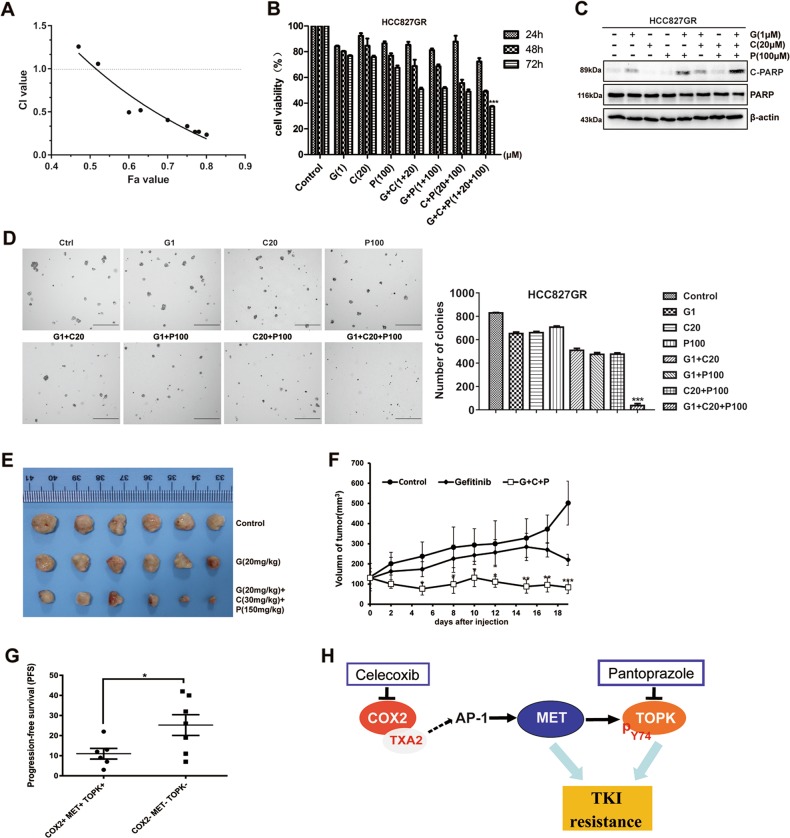
Fig. 6. Effects of combined treatment with gefitinib, celecoxib, and pantoprazole in vitro and in vivo.
a Combined effects were measured using CI values. Quantification of the potency of the different triple combinations using the Chou–Talalay method as described in the Materials and Methods section. Fa: Fraction affected. CI values < 1.0 correspond to synergistic inhibition effects, and the CI of gefitinib (1 μΜ), celecoxib (20 μΜ), and pantoprazole (100 μΜ) in HCC827GR was 0.495. b HCC827GR cells were treated with gefitinib (1 μΜ), celecoxib (20 μΜ), and pantoprazole (100 μΜ) alone, with the three distinct combinations of two inhibitors and with the triple combination for 24, 48, or 72 h. Then, the effects on cell growth were measured by MTT assay. Bars represent the SD of experiments repeated in triplicate. ***P < 0.001 for the triple combination of drugs vs. either control or drug alone or other two drugs. c HCC827GR cells were treated with the same drugs as b for 24 h and the samples were analyzed by western blotting. d The colonies in soft agar were compared in HCC827GR cells treated with gefitinib, celecoxib, or pantoprazole. Scale bar: 500 μm. ***P < 0.001 for the triple combination of drugs vs. either control or drug alone or other two drugs. e, f Mice were treated by intraperitoneal injection with vehicle, gefitinib, or gefitinib plus celecoxib plus pantoprazole for 19 days. Significant differences were determined by factorial analysis of variance (*P < 0.05, **P < 0.01, ***P < 0.001 vs. either vehicle or gefitinib alone). Representative photographs show the external appearance of tumors. g PFS analysis between COX2-, MET-, and TOPK-positive and -negative patients with EGFR-activating mutations. *P < 0.05. Data are represented as the means ± SD of triplicate experiments. h Schematic diagram showing the mechanism of COX2/MET/TOPK signaling in gefitinib-resistant cells

