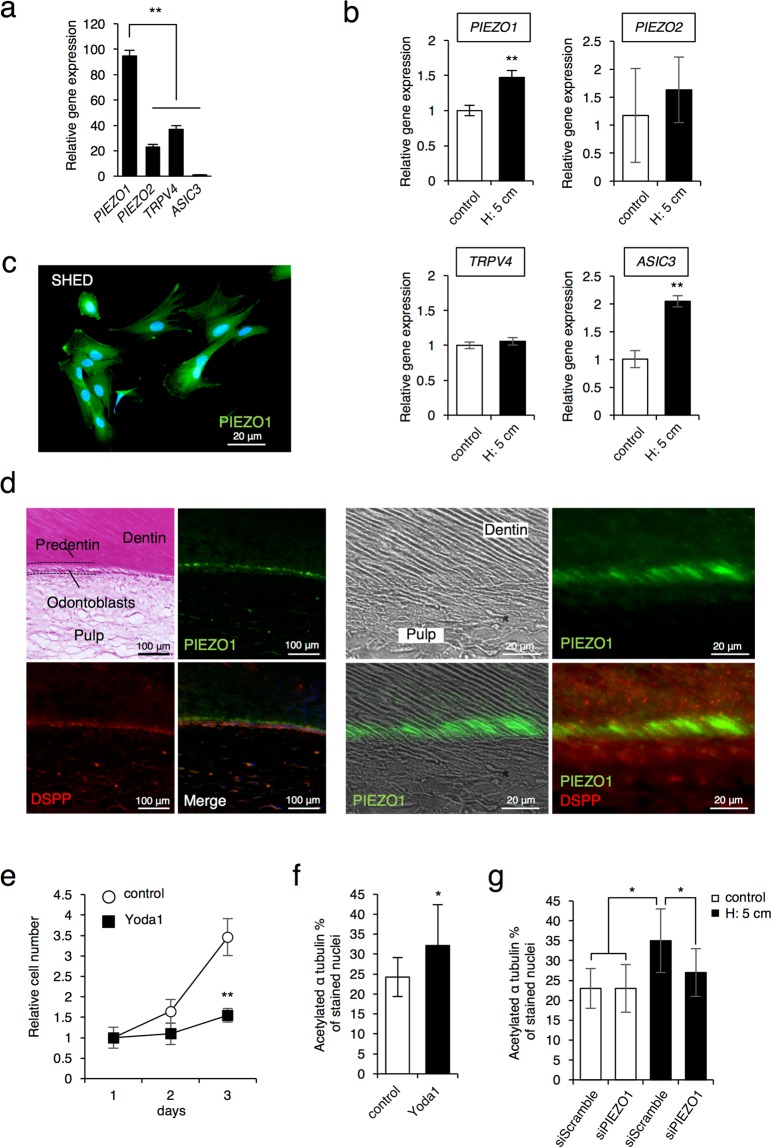
Figure 4.
PIEZO1 is primary mechanosensing recepor in SHED and odontoblasts. (a) Expression of mechanosensing receptors in SHED was examined by real-time RT-PCR. (b) Effect of the the HP by the medium height of 5 cm (H: 5 cm) on the expression of PIEZO1, PIEZO2, TRPV4, and ASIC3. SHED cells were cultured with osteogenic differentiation medium at 5 cm medium height (H: 5cm) for 24 hrs. The gene expression was examined by real-time RT-PCR. (c) Cellular localizations of PIEZO1 in SHED was determined by immunostaining. Green, PIEZO1; blue, DAPI; Scale bars, 20 μm. (d) Immunohistochemistry studies in the tooth section using PIEZO1 and DSPP antibodies. Green, PIEZO1; Red, DSPP, a marker of odontoblasts; blue, DAPI; Scale bars, 100 μm and 20 μm. (e) Effect of Yoda1 treatment on cell proliferation. SHED were culutured with or without 5 μM Yoda1 for 24, 48, and 72 hrs, and then cell proliferaiton was assessed by a cell counting method. (f) Effect of Yoda1 treatment on cilia formation. SHED cells were cultured with or without 5 μM Yoda1 for 6 hrs, and acetylated α-tubulin-positive cells were counted in twenty randomly selected fields of view under an inverted microscope (20X magnification). The bar graph shows the percentage of acetylated α-tubulin-expressing cells. (g) Effect of PIEZO1-specific siRNA transfection on cilia formation. SHED cells were transfected with scramble siRNA or PIEZO1-specific siRNA for 6 hrs and then cultured with or without the HP by the medium height of 5 cm (H: 5cm) for 6 hrs. The acetylated α-tubulin-positive cells were counted in twenty randomly selected fields of view under an inverted microscope (20X magnification). The bar graph shows the percentage of acetylated α-tubulin-expressing cells. The data presented in (a,b,e) are the representative of three independent experiments showed similar results. For the analyses, the represented in (f,g) show the data pooled from three independent experiments. The error bars indicate standard deviations. Statistical analysis was performed using analysis of variance (*p < 0.05, **p < 0.01).

