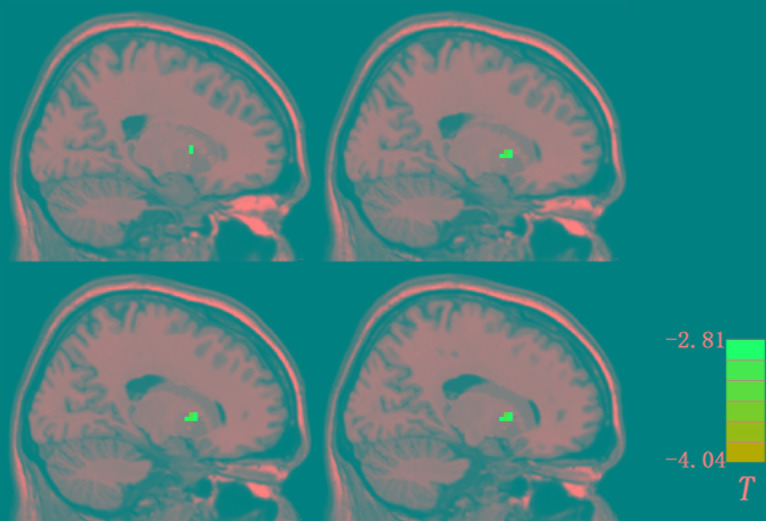
Figure 3.
Changes in fALFF after 1 week of olanzapine treatment within the patient group (the right putamen). The comparisons were limited to the brain regions with abnormal levels of fALFF at baseline. The figure is presented using the viewer of the REST software. Color bar indicates t-values of the group analysis. Blue color denotes decreased fALFF after 1 week of olanzapine treatment relative to the values at baseline (p < 0.05, corrected by the GRF method). fALFF, fractional amplitude of low frequency fluctuation; GRF, Gaussian random field.

