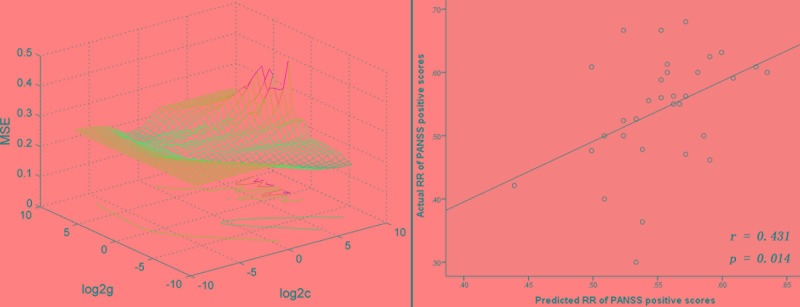
Figure 4.
SVR analysis indicates that decreased levels of fALFF in the right putamen after 1 week of olanzapine treatment may predict improvement in positive symptoms after 8 weeks of olanzapine treatment. Left: 3D visualization of SVR results with the best parameters (best c = 22.6274, g = 0.015625) using the grid search method. Right: A positive correlation between predicted and actual reduction rates of individual level PANSS positive symptoms subscale scores after 8 weeks of treatment (r = 0.431, p = 0.014). The predicted reduction rates were calculated based on decreased levels of fALFF in the right putamen after 1 week of olanzapine treatment using the LIBSVM software. SVR, support vector regression; MSE, mean square error; fALFF, fractional amplitude of low frequency fluctuation; PANSS, the Positive and Negative Syndrome Scale.

