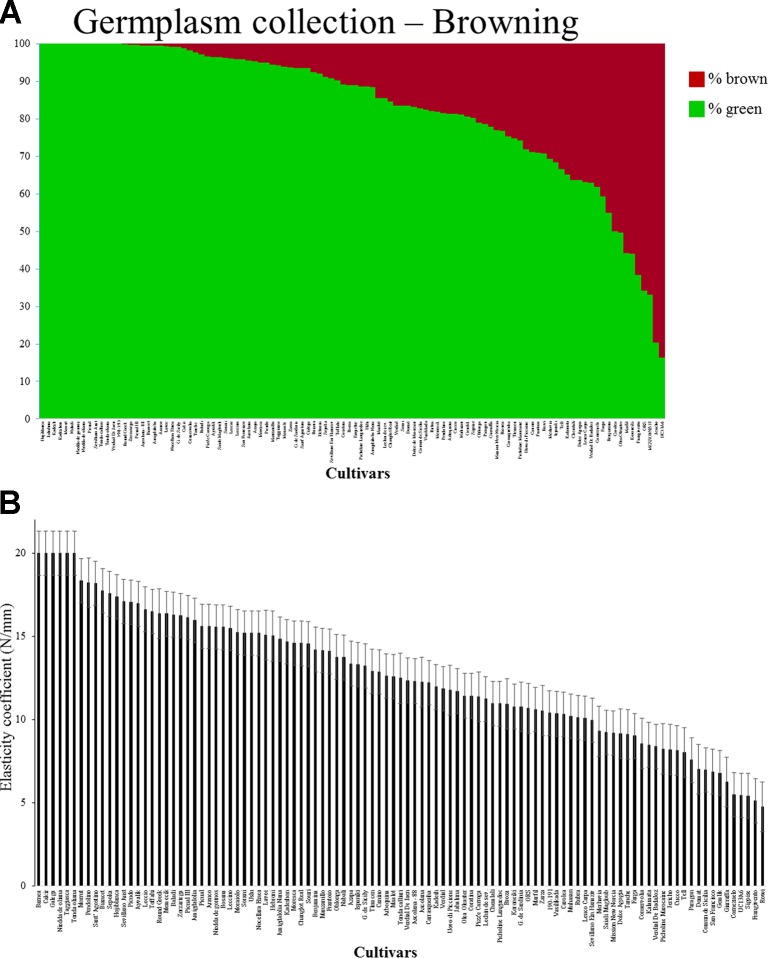
Figure 1.
(A) Proportional area (expressed in percentage) of the olive surface turned brown as a result of injury. This was measured by a two-dimensional photograph of the fruit of each cultivar. The values were plotted as a column graph. The green and brown column bars at each segment represent the percentage of green and brown colors, respectively, on the surface of the fruit. (B) Elasticity coefficient of each cultivar. Error bars represent confidence limits (n = 5; α = 0.05).

