
Figure 2. Cellular topology and tissue viscoelasticity in embryonic development.
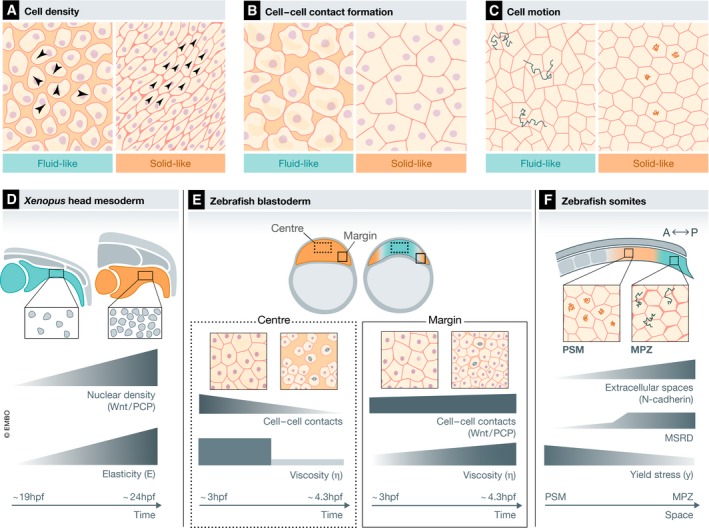
Schematic diagrams of the cellular topology of fluid‐like (blue shaded boxes) and solid‐like (orange shaded boxes) tissues as defined by different cellular parameters (A–C) and representative examples of such tissues in the developing embryo (D–E).
- At low cell density, cells display high and random cell motility (large black arrowheads, left panel) and low attachment to their neighbours, characteristic for a fluid‐like tissue. At high cell density, cell motion slows down and becomes more coordinated and directional (small black arrowheads, right panel), characteristic for a solid‐like tissue. A fluid‐to‐solid phase change for tissues that reach a critical density has been described as a jamming transition (Szabó et al, 2006; Sadati et al, 2013).
- At constant density, a tissue can acquire a fluid‐like state when its cells have small and weak cell–cell contacts (left panel) and a solid‐like state when its cells have large, mature and strong cell–cell contacts (right panel). Changes between solid and fluid phases for tissues that reach a critical adhesion value have been described as rigidity transitions or solidification (for fluid‐to‐solid) and fluidization (for solid‐to‐fluid) (Garcia et al, 2015).
- A confluent tissue (without interstitial gaps) with cells displaying asymmetric cell shapes and diffusive motion (exemplary trajectories in blue) is in a fluid‐like state (left panel), while a confluent tissue consisting of cells with highly symmetric cell shape and caged motion (exemplary trajectories in orange) is in a solid‐like state (right panel). A fluid‐to‐solid phase change of a tissue that reaches a critical value of cortical tension, adhesion and diffusive motility has been described as a density‐independent rigidity transition (Bi et al, 2015, 2016; Yang et al, 2017; Merkel & Manning, 2018).
- Schematics of Xenopus head mesoderm morphogenesis from the end of gastrulation (˜19 hpf) until the end of neurulation (˜24 hpf). At the end of gastrulation, the mesoderm displays low nuclear density (left panel), which gradually increases until the end of neurulation (right panel). This increase corresponds to a gradual increase in tissue elasticity (E) as measured by in vivo AFM. The increase in nuclear density and apparent elasticity depends on non‐canonical Wnt signalling (Barriga et al, 2018). The blue and orange tissues correspond to the rheological state as defined in (A).
- Schematics of the development of the zebrafish early embryo from blastula (˜3 hpf) to dome stage (˜4.3 hpf). At blastula, the blastoderm consists of highly adhesive cells with many, large and long‐lived cell–cell contacts and small interstitial gaps between each other (left panel) and displays uniform viscosity (η). Until the onset of doming (˜4 hpf), cells in the blastoderm centre gradually detach from each other leading to a gradual reduction in the number, size and longevity of cell–cell contacts and an increase in the size of interstitial gaps between these cells (dashed box, right panel). This eventually leads to an abrupt fluidization of the central blastoderm at the onset of doming, as measured by MPA. Non‐canonical Wnt signalling blocks tissue fluidization in the blastoderm margin (Petridou et al, 2019). The blue and orange tissues correspond to the rheological state as defined in (B).
- Schematics of the zebrafish body axis at 10‐somite stage (˜14 hpf). The body axis displays an anterior to posterior gradual decrease in the yield stress (y), with anterior tissues (PSM) being more rigid that the posterior tissues (MPZ), as measured by FDs. This is accompanied by an inverse gradient in the amount of extracellular spaces and random motion (MSRD). The establishment of the extracellular space and yield stress gradients depends on the function of N‐cadherin (Mongera et al, 2018). The blue and orange tissues correspond to the rheological state as defined in (C).