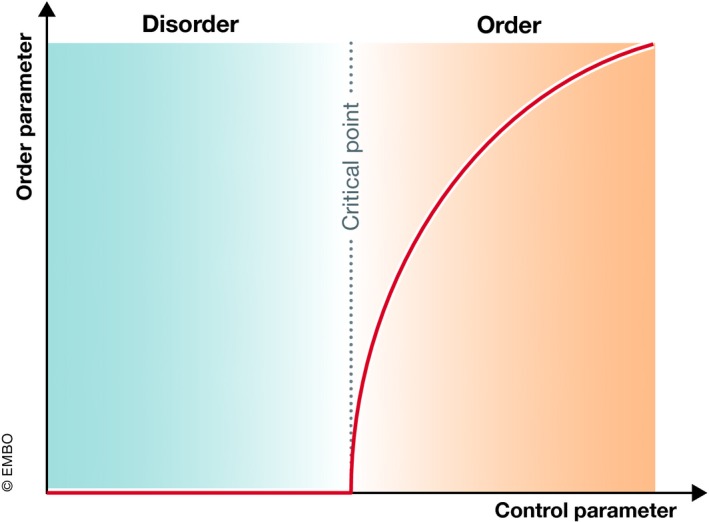
Figure 3. Phase diagram of an order–disorder phase transition.

When a large system undergoes a phase transition, at the critical point (dashed line), which corresponds to a certain value of the control parameter of the system (e.g. density, cell–cell adhesion, temperature), the order parameter (e.g. collective motion, rigid cluster size, magnetism) undergoes a sharp step (discontinuity) and diverges. The appearance or disappearance of the order parameter defines the ordered (e.g. solid‐like materials) or disordered (e.g. fluid‐like materials) states of the system, respectively.
