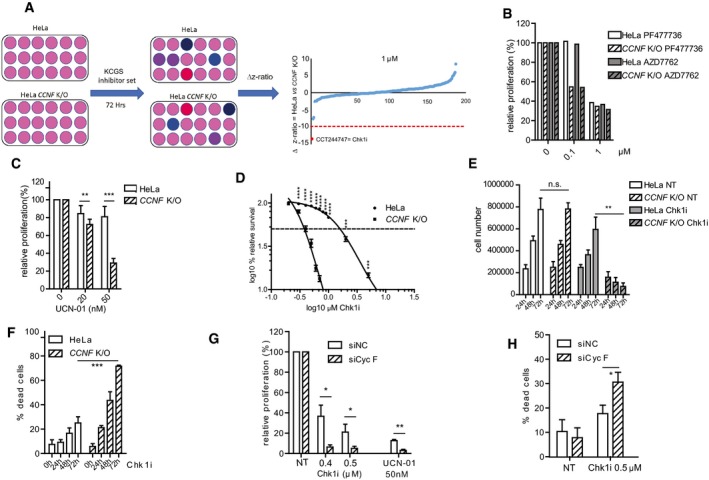
HeLa and cyclin F knock‐out (CCNF K/O) cells were treated with the kinase chemogenomic set (KSGS) in 384‐well format. After 72 h, viability was measured using resazurin. Flowchart representation (left). The robust Z‐score difference is plotted for data acquired at 1 μM concentration (right).
Cell survival measured using resazurin and compared to controls treated with DMSO (expressed as relative proliferation %). Cells were treated with the indicated inhibitors at 0.1 and 1 μM concentration.
Cell survival measured using resazurin and compared to controls (0) treated with DMSO (expressed as relative proliferation %). Cells were treated with UCN‐01 at the indicated concentrations.
Differences in viability of HeLa and CCNF K/O cells after treatment with specific Chk1i (LY2603618) at the indicated concentrations plotted on a log10 scale to measure differences in IC50.
Number of HeLa and CCNF K/O cells left untreated or treated with Chk1i (LY2603618) for 24, 48 or 72 h as indicated. (n.s. = non‐significant).
Cell viability measurements (expressed as number of dead cells %) using propidium iodide staining for HeLa and CCNF K/O cells after treatment with Chk1i (LY2603618).
U‐2‐OS cells were seeded and transfected with non‐targeting siRNA siNC (negative control) or siCyc F. Twenty‐four hours after transfection, cells were treated with UCN‐01 or Chk1i (LY2603618) at indicated concentrations for 3 days before viability was measured.
Cell viability measurements LY2603618 using propidium iodide staining in U‐2‐OS cells transfected with non‐targeting siNC and siCyc F and treated with Chk1i (LY2603618) as indicated.
Data information: Data are presented as mean ± standard deviation (SD), with at least three independent experiments.
‐test. NT = treatment with DMSO.

