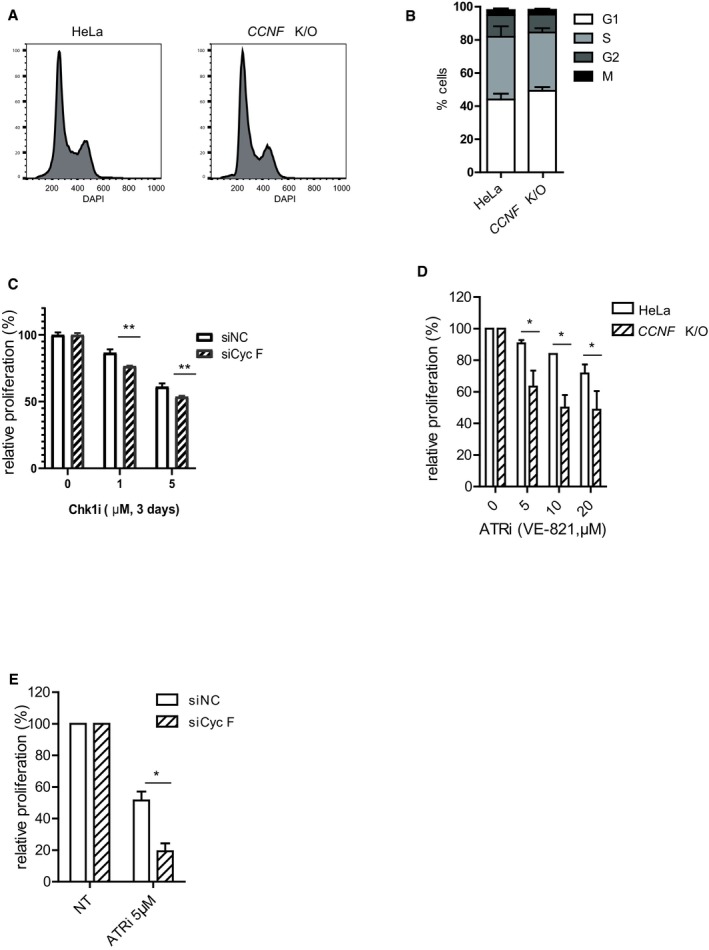
Figure EV1. Cyclin F loss promotes cell death after checkpoint inhibition (related to Fig 1).

- Cell cycle profile of HeLa and CCNF K/O detected by FACS using DAPI.
- Cell cycle distribution of untreated HeLa and CCNF K/O cells using combined phospho‐histone H3 Serine 10 and EdU staining.
- Cell survival of RPE cells transfected with non‐targeting siRNA siNC (negative control) or siCyc F after treatment with Chk1i (LY2603618) at indicated concentrations compared to DMSO‐treated controls (NT).
- Cell survival measured using resazurin and compared to controls treated with DMSO (expressed as relative proliferation %). Cells were treated with ATR inhibitors at the indicated concentrations.
- Cell survival of U‐2‐OS cells transfected with non‐targeting siRNA siNC (negative control) or siCyc F after treatment with Chk1i (LY2603618) at indicated concentrations compared to DMSO‐treated controls (NT).
