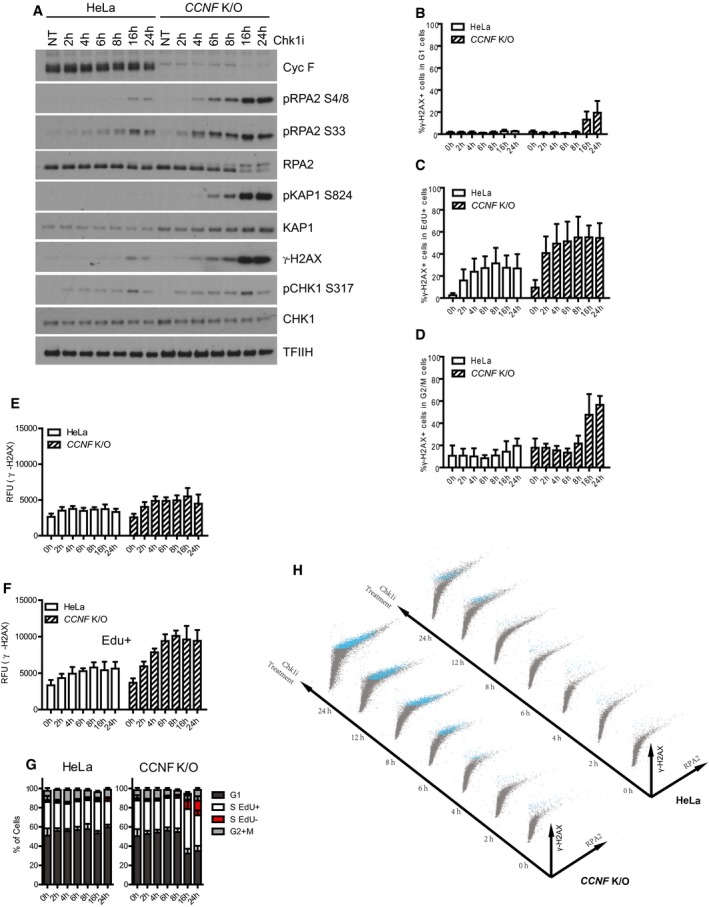
Cells treated with 1 μM Chk1i (LY2603618) for the indicated hours (h) were harvested and lysed using SDS. Indicated proteins were resolved by SDS–PAGE and detected by Western blot (WB). TFIIH was used as a loading control.
Percentage (%) of γ‐H2AX‐positive cells in G1 cells after Chk1i (LY2603618) treatment for the indicated hours (h) measured using Fluorescence Activated Cell Sorting (FACS). G1 cells were considered having DAPI 2n staining and EdU negative.
Percentage (%) of γ‐H2AX‐positive cells in replicating (EdU+) cells after Chk1i (LY2603618) treatment at the indicated time points.
Percentage (%) of γ‐H2AX‐positive cells in G2/M cells after Chk1i (LY2603618) treatment. G2/M cells were considered having DAPI 4n staining and EdU negativity.
Intensity of γ‐H2AX measured as relative fluorescence units (RFU) in early S phase cells treated with Chk1i. Mean intensity of γ‐H2AX fluorescence was evaluated from EdU+ cells with 2N DAPI content.
Intensity of γ‐H2AX measured as relative fluorescence units (RFU) in replicating cells treated with Chk1i. Mean intensity of γ‐H2AX fluorescence was evaluated from EdU+.
Overall cell cycle profile of HeLa and CCNF K/O cells after Chk1i treatment. Cells with 2n DAPI staining but EdU− were gated as G1 cells; cells with > 2n but < 4n DAPI staining but EdU− were gated as EdU− S cells; cells with > 2n but < 4n DAPI staining but EdU+ were gated as EdU+ S phase; cells with 4n DAPI and pH3 S10‐negative staining were gated as G2 phase and cells with 4n DAPI and pH3 S10 positive as M cells. Data from at least three independent replicate experiments were plotted as Mean ± SD.
Representative plots of γ‐H2AX versus RPA2 signal of HeLa and CCNF K/O cells after treatment with 1 μM Chk1i (LY2603618) at the indicated hours (h). Blue labelled dots represent γ‐H2AX‐positive cells. Relates to Materials section for details on representation.
Data information: Data from at least three independent biological replicates were plotted with Mean ± SD (B–D) or Mean RFU ± SD (E, F).

