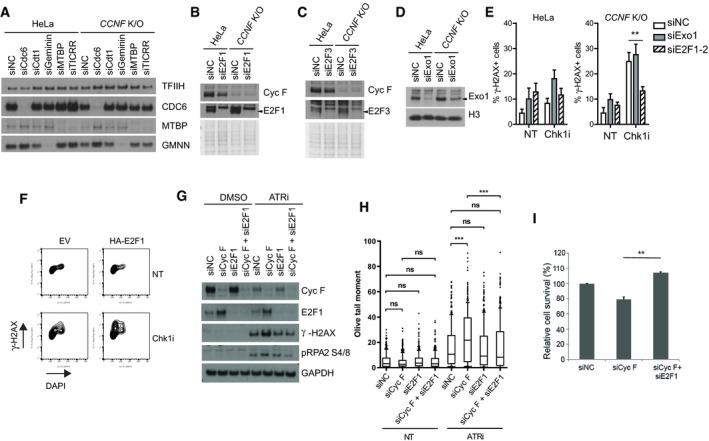
HeLa and
CCNF K/O cells were transfected with the indicated siRNA for 48 h were harvested and lysed using SDS. Indicated proteins were resolved by SDS–PAGE and visualised by WB. The image verifies knockdown efficiency of experiments presented in Fig
4A and B. TFIIH was used as a loading control.
WB of indicated proteins as in (A). Ponceau S staining is a loading control.
WB of indicated proteins as in (A). Ponceau S staining is a loading control.
WB of indicated proteins as in (A). H3 is a loading control.
Percentage (%) of γ‐H2AX‐positive cells in HeLa and CCNF K/O after indicated siRNA transfection and 1 μM Chk1i for 20 h. Percent of γ‐H2AX‐positive cells were plotted as mean % ± SD (**P < 0.005). Data were calculated from triplicate experiments using two‐tailed paired t‐test.
Representative FACS plots of γ‐H2AX versus DAPI signal of HeLa cells transfected with empty vector (EV) or HA‐E2F1 untreated or treated with 1 μM Chk1i for 20 h.
Cells transfected with non‐targeting siRNA (siNC) or indicated siRNAs were left untreated (DMSO) or treated with ATRi (VE‐821, 1 μM) for 24 h. Cells were harvested and lysed using a Triton X‐100‐based lysis buffer. Indicated proteins were resolved by SDS–PAGE and visualised by WB.
Quantification of comet tails in alkaline gel. At least 100 cells, across two slides, were analysed in each condition in three biological replicates. Data are shown as medians, with 25/75% percentile range (box) and 10–90% percentile range (whiskers). P‐values were calculated using the Mann–Whitney test (two‐tailed). Olive tail moment = (Tail.mean − Head.mean)*Tail%DNA/100 ***P < 0.0005.
Cells transfected with indicated siRNAs are subjected to ATR (VE‐821, 1 μM) inhibition for 24 h. Percentage survival of each cell line was assessed via resazurin viability assay and plotted as mean % ± SD (**P < 0.005). Data were calculated from triplicate experiments using two‐tailed paired t‐test. For simplification, survival rates were normalised to non‐targeting control siNC treated with ATRi.

