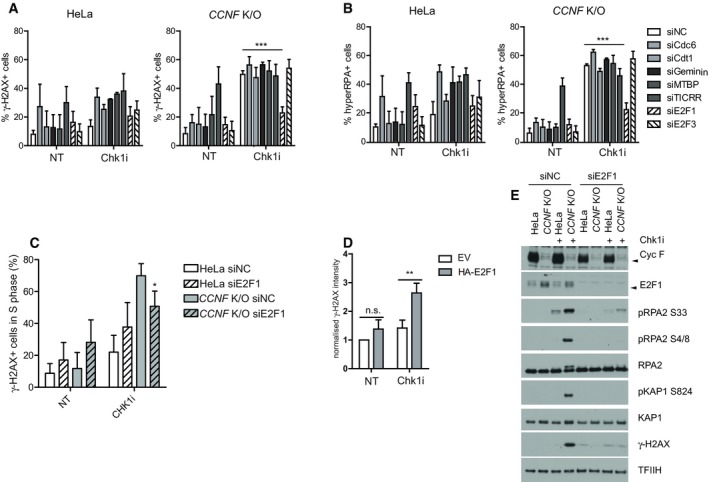
Figure 4. E2F1 mediates DNA replication catastrophe in cyclin F K/O cells treated with Chk1 inhibitors.

- Percentage (%) of γ‐H2AX‐positive cells in HeLa and CCNF K/O cell lines after transfection of the indicated siRNAs and treatment with Chk1i for 20 h. Percent of γ‐H2Ax‐positive cells was plotted as mean % ± SD.
- Percentage (%) of hyper‐RPA‐positive cells in HeLa and CCNF K/O cell lines after transfection of the indicated siRNAs and treatment with Chk1i for 20 h. Percent of hyper‐RPA‐positive cells was plotted as mean % ± SD.
- Percentage (%) of γ‐H2AX‐positive cells in S phase cells by DAPI content after Chk1i (LY2603618). Related to the experiments presented in (A).
- Relative γ‐H2AX intensity in cells transfected with either empty vector (EV) or HA‐E2F1, treated with Chk1i for 20 h. γ‐H2AX fluorescence in HA‐positive cells was normalised to the empty vector (EV) transfected cells and compared to cells not expressing HA. Related to Fig EV3F.
- HeLa and CCNF K/O cells transfected with the indicated siRNA and treated with 1 μM Chk1i (LY2603618) for 20 h were harvested and lysed using SDS. Indicated proteins were resolved by SDS–PAGE and detected by WB. TFIIH is a loading control.
