. 2019 Sep 30;7(9):e13703. doi: 10.2196/13703
©Corinna Anna Anna Faust-Christmann, Bertram Taetz, Gregor Zolynski, Tobias Zimmermann, Gabriele Bleser. Originally published in JMIR Mhealth and Uhealth (http://mhealth.jmir.org), 30.09.2019
This is an open-access article distributed under the terms of the Creative Commons Attribution License (https://creativecommons.org/licenses/by/4.0/), which permits unrestricted use, distribution, and reproduction in any medium, provided the original work, first published in JMIR mhealth and uhealth, is properly cited. The complete bibliographic information, a link to the original publication on http://mhealth.jmir.org/, as well as this copyright and license information must be included.
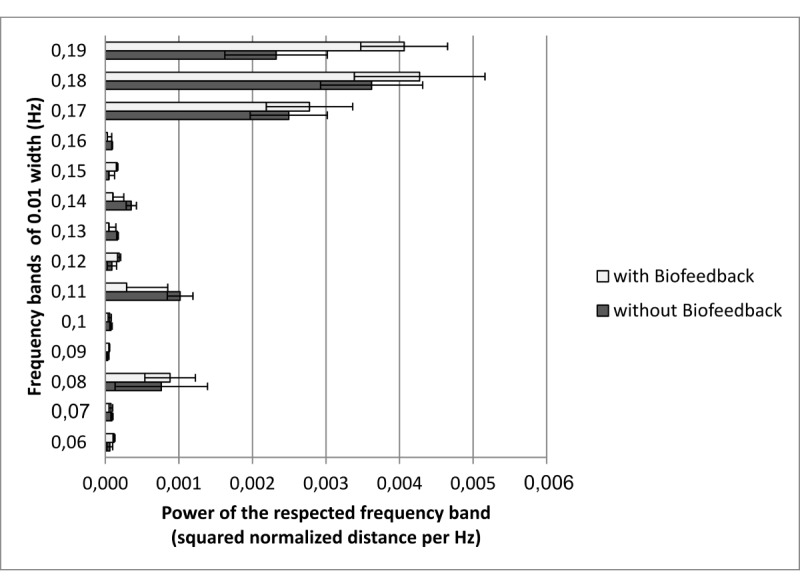
Figure 3.

Mean powers of frequency bands in the baseline block for both groups. Error bars indicate standard error of the mean.
