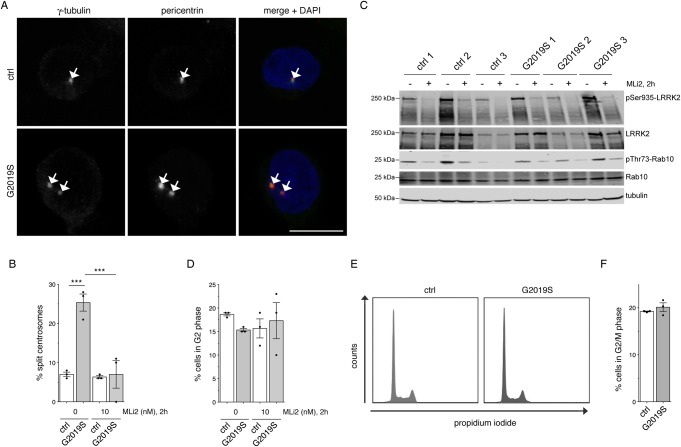
Figure 1. Monitoring centrosomal cohesion deficits and cell cycle alterations in a subset of healthy control and G2019S LRRK2-PD LCLs.
(A) Example of healthy control (ctrl) or G2019S LRRK2 PD-derived LCLs (G2019S) stained for two centrosomal markers (γ-tubulin and pericentrin) and DAPI. Scale bar, 10 µm. (B) The centrosome phenotype was quantified from 100 cells per line, and from three control and three G2019S LRRK2 LCL lines. Control or G2019S LRRK2 LCLs were treated with MLi2 (10 nM) for 2 h as indicated. Bars represent mean ± s.e.m.; *** P < 0.005 (one-way ANOVA with Tukey's post-hoc test). (C) Cells were incubated either in the presence or absence of 10 nM MLi2 for 2 h as indicated, and extracts analyzed for LRRK2 Ser935, LRRK2, Rab10 Thr73, Rab10, or tubulin as loading control. Membranes were developed using the Odyssey CLx scan Western blot imaging system, and antibodies multiplexed as described in Materials and methods. (D) Quantification of the percentage of cells displaying duplicated centrosomes, a phenotype mainly reflecting cells in G2 phase (% cells in G2 phase). A total of 100 cells per line were quantified from the three control and three G2019S LRRK2 LCL lines in the absence or presence of MLi2 (10 nM) for 2 h as indicated. (E) Example of flow cytometry traces of one control and one G2019S line upon propidium iodide staining as indicated. (F) Quantification of the percentage of cells displaying duplicated DNA content as assessed by propidium iodide staining (% cells in G2/M phase) from three control and three G2019S LRRK2 LCL lines.

