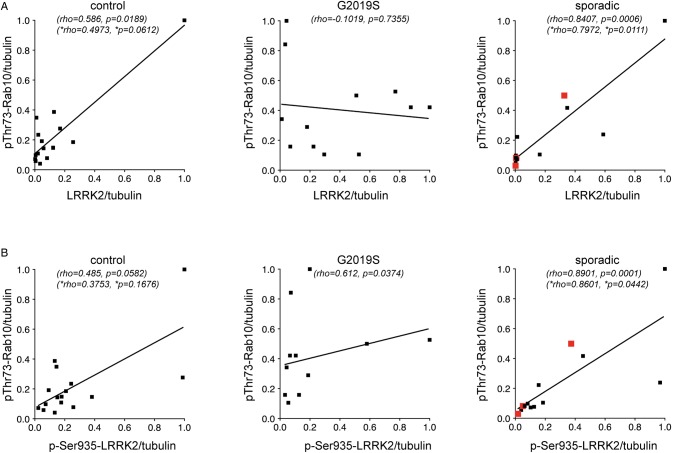
Figure 5. Correlation analysis between levels of LRRK2 or LRRK2 Ser935 and Rab10 Thr73 in LCLs from control, G2019S LRRK2-PD and sporadic PD patients.
(A) Spearman correlation analysis revealed a significant association between LRRK2 levels and Rab10 Thr73 levels in sporadic PD patients. (B) Spearman correlation analysis revealed a significant association between LRRK2 Ser935 levels and Rab10 Thr73 levels in sporadic PD samples. The maximal datapoint value in each genotype was normalized to 1. Rho and P values including all data sets (top), or excluding the outlying datapoint (bottom, *) are indicated for each correlation analysis. Red datapoints indicate the three sporadic PD samples which display a centrosomal cohesion deficit.

