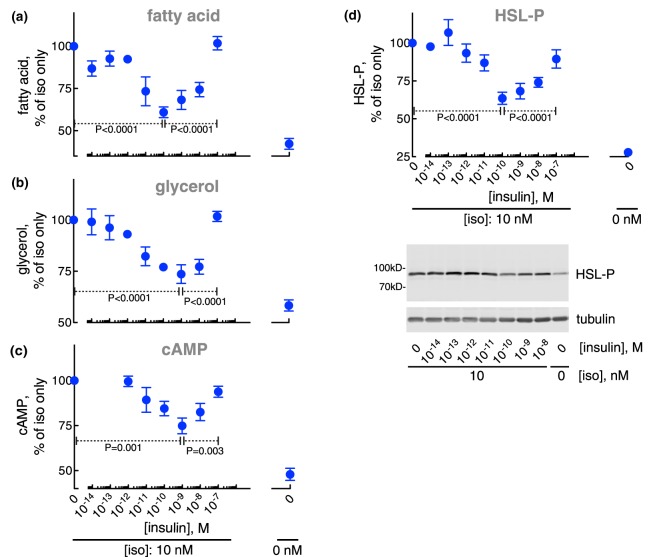
Figure 1. Control of lipolysis.
Adipocytes from non-diabetic subjects were incubated with the indicated concentration of insulin for 15 min, when 10 nM isoproterenol (iso) was added and cells incubated for another 10 min. Cells were then separated from medium and fatty acids (n = 26) (a), and glycerol (n = 37) (b) were determined in the medium, and cAMP (n = 20) (c) and the phosphorylation of HSL (n = 19) (d) were determined in the cells. Indicated are P-values for the effect of 0.1 nM insulin compared with no insulin, and to 100 nM insulin, respectively, on isoproterenol-stimulated cells (a–d). Representative immunoblots of one experiment are shown (d).

