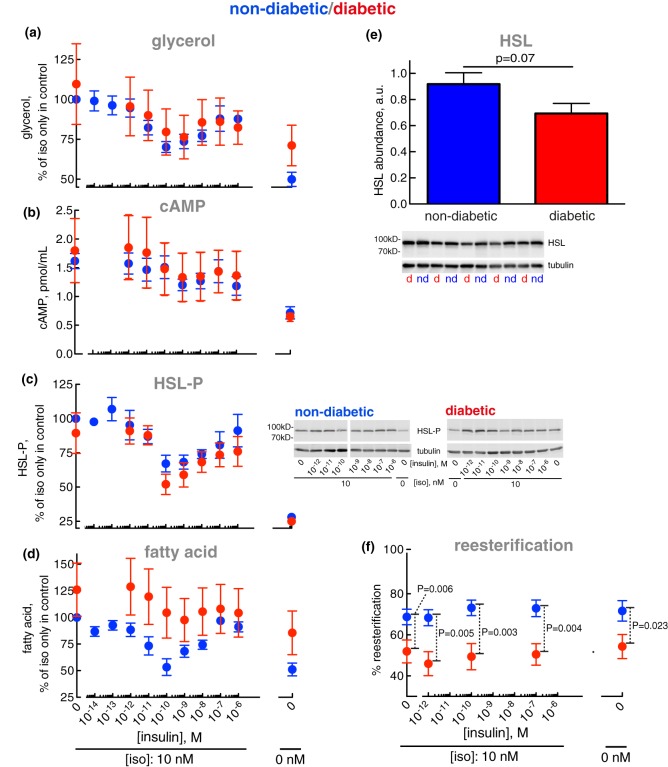
Figure 14. Control of lipolysis — normally and in T2D.
Adipocytes from non-diabetic control subjects (blue) or patients with T2D (red) were incubated with the indicated concentration of insulin for 15 min, when 10 nM isoproterenol (iso) was added and cells incubated for another 10 min. The indicated analyte was then determined in the medium (glycerol and fatty acids) or in the cells (cAMP, HSL phosphorylation). Individual subject characteristics and clinical data are presented in Supplementary Table S1. (a) Glycerol: six non-diabetic control subjects [mean age 65 years (range 46–86); mean BMI 24 kg/m2 (range 18–28)] and seven subjects with T2D [mean age 67 years (range 45–77); mean BMI 32 kg/m2 (range 28–40)]. The non-diabetic control subjects had a mean fasting plasma concentration of glucose of 6.2 mM (range 4.9–7.3); and a mean concentration of insulin of 5.8 mIU/l (range 2.0–11.0). The diabetic subjects had a mean fasting plasma concentration of glucose of 9.2 mM (range 6.3–12); and a mean concentration of insulin of 22 mIU/l (range 5.9–69). Because absolute levels of fatty acid and glycerol released from the adipocytes varied between donors, in order to compare non-diabetic and diabetic cells, data are presented as % of release in the presence of isoproterenol only, in the non-diabetic cells; and in diabetic cells as % of the average release, of all experiments, in the presence of isoproterenol only in the non-diabetic cells. (b) cAMP: seven non-diabetic control subjects [mean age 65 years (range 40–78); mean BMI 26 kg/m2 (range 20–28)] and 10 subjects with T2D [mean age 69 years (range 45–83); mean BMI 33 kg/m2 (range 28–40)]. The non-diabetic control subjects had a mean fasting plasma concentration of glucose of 6.3 mM (range 5.0–8.7); and a mean concentration of insulin of 8.6 mIU/l (range 1.9–22). The diabetic subjects had a mean fasting plasma concentration of glucose of 8.9 mM (range 5.4–12); and a mean concentration of insulin of 15 mIU/l (range 5.9–39). (c) HSL phosphorylation: nine non-diabetic control subjects [mean age 64 years (range 44–86); mean BMI 25 kg/m2 (range 18–28)] and seven subjects with T2D [same as in (a)]. The non-diabetic control subjects had a mean fasting plasma concentration of glucose of 6.1 mM (range 4.9–7.3); and a mean concentration of insulin of 6.2 mIU/l (range 2.0–13.0). The diabetic subjects had a mean fasting plasma concentration of glucose and insulin the same as in (a). Representative immunoblots of HSL-P in (c) are shown for one non-diabetic and one diabetic subject. (d) Fatty acids: seven non-diabetic control subjects [mean age 69 years (range 53–86); mean BMI 24 kg/m2 (range 18–28)] and seven subjects with T2D [same as in (a)]. The non-diabetic control subjects had a mean fasting plasma concentration of glucose of 6.6 mM (range 4.9–7.5); and a mean concentration of insulin of 6.7 mIU/l (range 2.0–13.0). The diabetic subjects had a mean fasting plasma concentration of glucose and insulin the same as in (a). (e) The abundance of HSL was determined by SDS–PAGE and immunoblotting in adipocytes from 10 non-diabetic control subjects (blue) [mean age 46 years (range 34–73); mean BMI 24 kg/m2 (range 20–28)] and 10 subjects with T2D (red) [mean age 55 years (range 45–83); mean BMI 37 kg/m2 (range 31–43)]. The non-diabetic control subjects had a mean fasting plasma concentration of glucose of 6.0 mM (range 4.8–7.6); and a mean concentration of insulin of 3.9 mIU/l (range 1.6–9.1). The diabetic subjects had a mean fasting plasma concentration of glucose of 9.0 mM (range 5.4–12.3); and a mean concentration of insulin of 31 mIU/l (range 6.0–173). d, diabetic; nd, non-diabetic. (f) Re-esterification was determined. Adipocytes from 18 non-diabetic control subjects (blue) [mean age 62 years (range 43–86); mean BMI 24 kg/m2 (range 20–28)] or seven subjects with T2D (red) [mean age 67 years (range 45–77); mean BMI 32 kg/m2 (range 28–40)] were incubated with the indicated concentration of insulin for 15 min, when 10 nM isoproterenol was added and cells incubated for another 10 min. Cells were then separated from medium and fatty acids and glycerol were determined in the medium. The difference between glycerol and fatty acids released (triacylglycerol → 1 glycerol + 3 fatty acids) is defined as reesterification. The reesterification is calculated as % of released fatty acids that were reesterified: 100 × [(3 × glycerol − fatty acids)/3 × glycerol]. The non-diabetic control subjects had a mean fasting plasma concentration of glucose of 6.1 mM (range 4.9–8.0); and a mean concentration of insulin of 7.0 mIU/l (range 2.0–16). The diabetic subjects had a mean fasting plasma concentration of glucose of 9.2 mM (range 6.3–12.3); and a mean concentration of insulin of 22 mIU/l (range 5.9–69).

