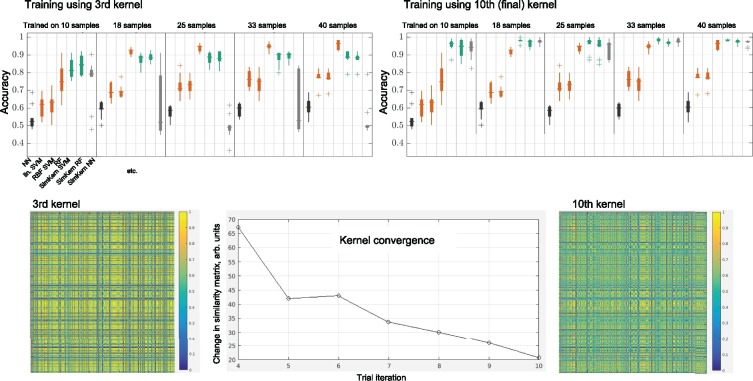
Fig. 8.
Varying simulation trials experiments for the network flow model. The upper two box plots compare the learning accuracy for a kernel from the third of R = 10 trials versus the final kernel. The kernels themselves are displayed with the same color scale below, and centered at bottom displays the convergence of the kernel (measured using the Frobenius matrix norm) over the ten trials

