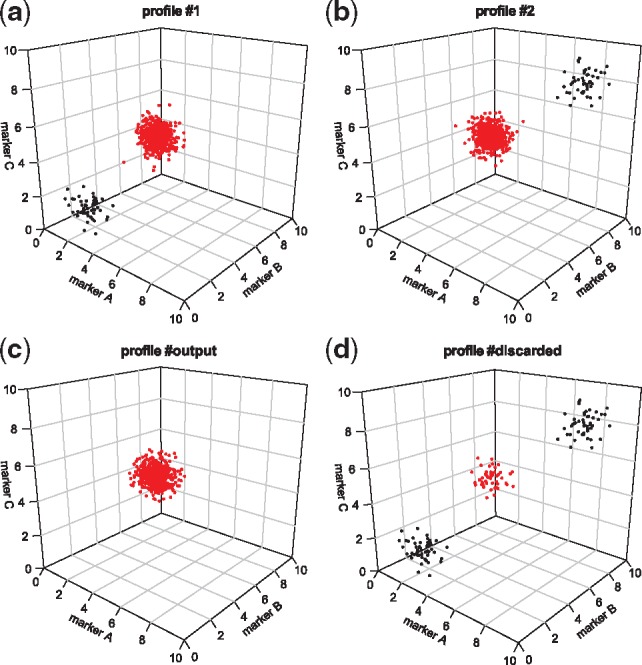
Fig. 1.

3D representation of the merging process. Axes correspond to backbone markers and cells are positioned based on their marker expressions. (a) and (b) Profiles #1 and #2 correspond to the cytometric profiles to merge. Red dots correspond to cells with acceptable neighbors between the two cytometric profiles. Black dots correspond to cells without acceptable NNs. (c) Profile #output represents the merged cytometric profile. Red dots correspond to the combined phenotypes of cells from profiles #1 and #2 with non-ambiguous and acceptable NNs. (d) Profile #discarded corresponds to cells without acceptable NNs. The presence of red dots (i.e. cells with potential acceptable neighbors) in the profile #discarded can be explained by a higher number of cells in one of the two cytometric profiles
