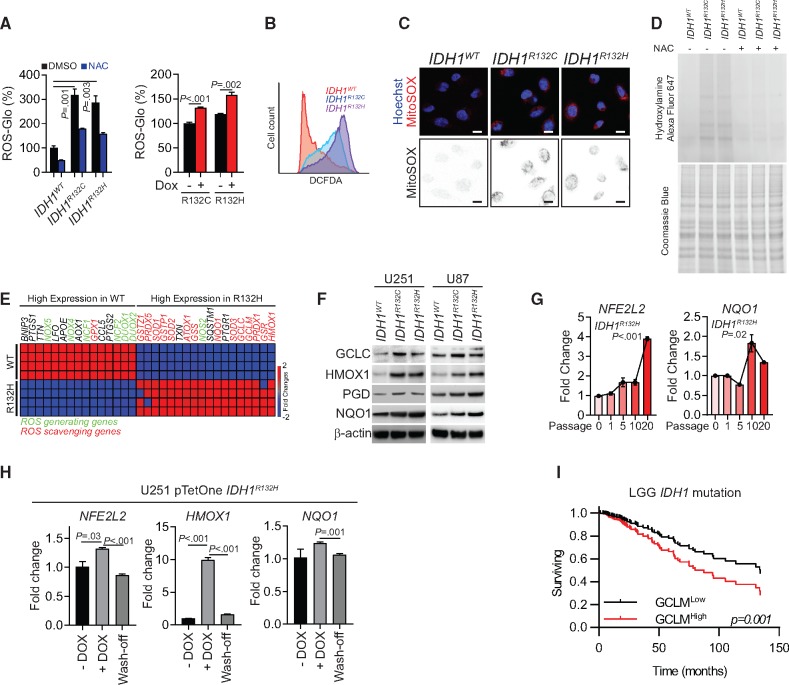
Figure 1.
Redox homeostasis in IDH1-mutated cells. A) Quantification of reactive oxygen species (ROS) levels by ROS-Glo H2O2 assay is shown for IDH1-mutated U251 cells (left panel) or doxycycline (DOX)-induced mutated-IDH1 expression U251 model (right panel). All groups were normalized to IDH1WT dimethylsulfoxide group. N-acetylcysteine (NAC) was used as a ROS scavenger. B) Flow cytometry analysis of ROS level using CM-H2DCFDA staining in IDH1-mutated U251 cells is shown. C) Confocal microscopy of mitochondrial ROS in IDH1-mutated cells was performed using MitoSOX staining (red). Cell nuclei were labeled with Hoechst 33342 (blue). MitoSOX signal is highlighted in the binary image (lower panel). Scale bar = 10 μm. D) Protein carboxylation analysis was done in lysate from IDH1-mutated U251 cells (upper panel). Coomassie blue staining was used as loading control (lower panel). E) Gene expression assay quantified ROS generating and scavenging genes from IDH1WT and IDH1R132H U251 cells. F) Immunoblot analysis for expression of NRF2 and ROS scavenging genes in IDH1-mutated glioma cells is shown. β-actin was used as loading control. G) Expression of NFE2L2 and NQO1 was measured by real-time polymerase chain reaction after 10–20 passages of DOX-induced mutated-IDH1R132H expression in U251 cells. All groups were normalized to passage 0 group. H) Expression level of NFE2L2, HMOX1, and NQO1 were measured by real-time polymerase chain reaction after removing mutated-IDH1R132H expression in U251 cells. All groups were normalized to DOX group. I) Cox regression analysis for the association between IDH1-mutation status and patient outcome (n = 366) is shown for lower-grade gliomas. P values were calculated using a two-sided Student t test. Error bars represent standard deviation. DMSO = dimethylsulfoxide; LGG = low-grade glioma; NAC = N-acetylcysteine.

