Figure 4.
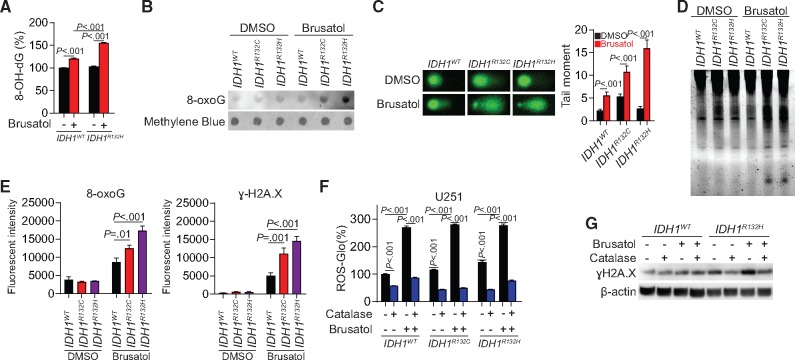
Effect of Brusatol to the genetic integrity in IDH1-mutated cells. A) 8-hydroxydeoxyguanosine level was measured using oxidative DNA damage ELISA assay in IDH1-mutated U251 cells with brusatol treatment. B) 8-oxoguanine (8-oxoG) level was measured using dot blot assay in IDH1-mutated U251 cells with brusatol treatment. C) DNA fragmentation was measured by comet assay in IDH1-mutated U251 cells with brusatol treatment (left panel). Quantification of the tail moments is shown (right panel). D) DNA fragmentation was measured by electrophoresis in IDH1-mutated U251 cells with brusatol treatment. E) Quantification of immunofluorescent staining was performed by mean fluorescent intensity of 8-oxoG (left panel) and ɣH2A.X (right panel) in brusatol treated U251 cells. F) Reactive oxygen species (ROS) level was measured using ROS-Glo H2O2 assay in U251 cells treated with brusatol and exogenous ROS scavenger catalase. G) DNA damage (ɣH2A.X expression) was measured using Immunoblot in IDH1-mutated U251 cells treated with brusatol and ROS scavenger catalase. β-actin was used as loading control. All groups were normalized to IDH1WT dimethylsulfoxide group. P values were calculated using a two-sided Student t test. Error bars represent standard deviation. 8-OH-dG = 8-hydroxydeoxyguanosine; DMSO = dimethylsulfoxide.

