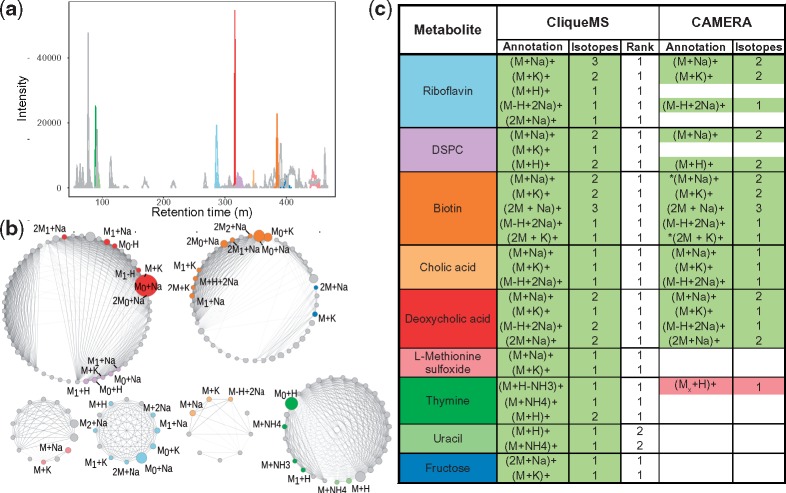
Fig. 2.
Feature annotation for a mixture of standards. (a) Extracted ion chromatogram. The nine ionized metabolites were annotated with CliqueMS. We show features that are adducts of each metabolite in different colors (shades of grey), as annotated by CliqueMS in (c). (b) Cliques identified by CliqueMS in the same experiment, after computing cosine correlation and maximizing clique likelihood. The intensity of the link is proportional to the correlation, and the area of each node is proportional to feature intensity. The colors are the same as in (a). For each feature, we show the annotation given by CliqueMs as shown in (c). We denote isotopes by adding a subindex to M, so that M0 corresponds to the monoisotopic mass and M1 to the first isotope. (c) Feature annotation by CliqueMS and CAMERA. For each metabolite, we show the different adducts annotated and the total number of isotopic variants of that particular adduct. Correctly annotated features are shown in green; incorrectly annotated features are shown in red (darker shade of grey), with indicating that the associated parental neutral mass was incorrect; non-annotated features are shown in white. For CliqueMS, we also show the ranking of the feature annotation that matches manual annotation. For CAMERA the * indicates those features for which the algorithm returned two possible annotations. DSPC stands for 1, 2-distearoyl-sn-glycero-3-phosphocholine. See Supplementary Material for CliqueMS annotations

