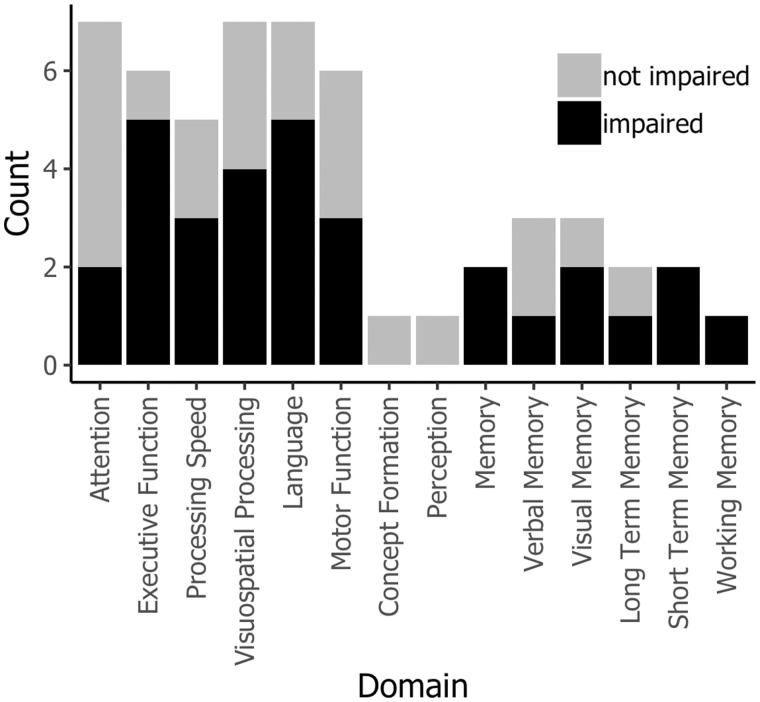
Figure 1.
Profile of cognitive deficits identified in the seven meta-analyses considered in this paper. For these purposes, domains are classified as simply “impaired” or “not impaired” using conventional statistical significance. For each domain, black bars indicate the count of meta-analyses that found the domain to be impaired, and gray bars provide context in terms of the count of meta-analyses that did not find impairment. Some domains are reported more than others. For papers that report different comparison types separately (18,21,25), we show the cross-sectional data.

