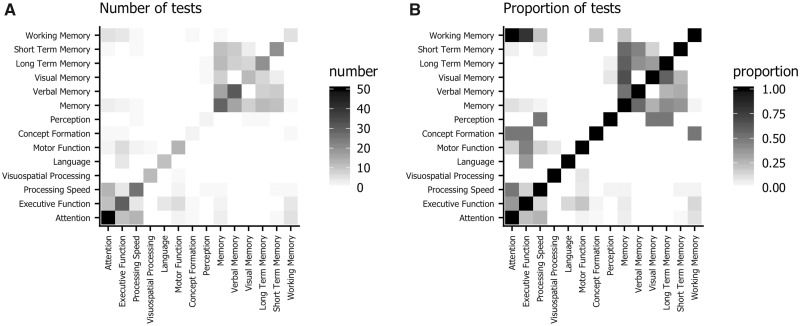
Figure 3.
Confusion matrix for domains in the meta-analyses. Each row and column represents a domain. The value in each cell indicates how often a test classified into the row domain is classified into the column domain in other meta-analyses. A) shows the absolute number of tests, and in B) data are normalized by the total number of tests in the row domain. For example, the upper-left corner indicates that tests classified into Working Memory by some meta-analysis authors are often classified into Attention by other authors.

