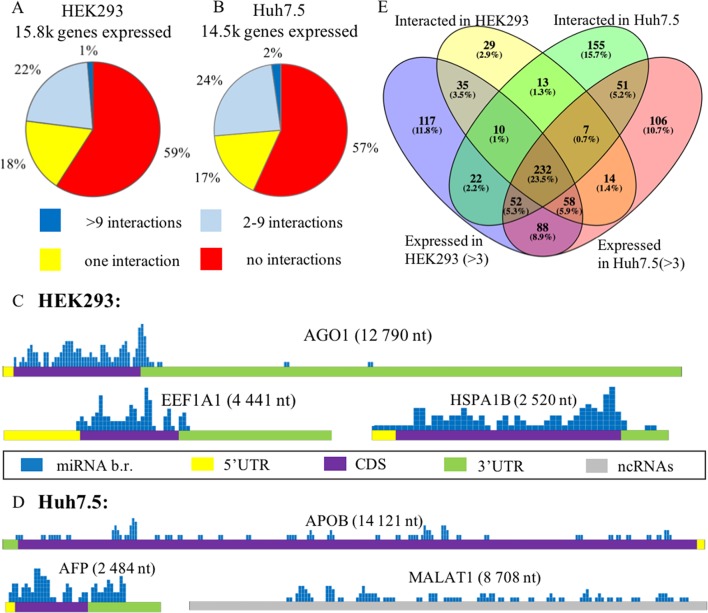
Figure 2.
Expression analysis of microRNA and mRNA in HEK293 and Huh7.5 cell lines. (A) and (B): Analysis of expressed genes according to amounts of their interactions with microRNAs in HEK293 (A) and Huh7.5 (B) cell lines. (C) and (D): Overview of the microRNA-binding regions locations in sponge-like RNAs expressed in HEK293/CLASH (C) and Huh7.5/CLEAR-CLIP (D) datasets. After segmenting each of the presented RNAs into 50-nt pieces, the segments that interacted with microRNAs were marked blue on the mRNA map. The height represents the number of interactions detected in each of the segment. For each of the sponge-like RNAs, both name and length are placed above the gene schematics. Colored parts of RNAs are labeled as follows: 5’UTR—yellow, coding region—violet, 3’UTR—green, noncoding region—gray. (E) The overlaps between expressed and interacting microRNAs in HEK293 and Huh7.5 cell lines.

